
These results show unequivocally the vital role shopping centers play in the everyday lives of millions of Americans. Whether it is to pick up a loaf of bread and gallon of milk, grab a slice of pizza or a whole pie to-go, or stop in for a haircut and drop off the dry cleaning, shopping centers are overwhelmingly the places that satisfy the daily needs of consumers across the U.S.
Convenience Goods and Food Options Drive Shopper Frequency
In asking Americans about their weekly trips to shopping centers, the survey split the questions into two broad categories: goods and services. Within each of these, respondents were asked to indicate their shopping frequency for four specific types of goods or services. These subcategories and the corresponding average number of weekly shopping trips are as follows:
GOODS
Convenience Items and Necessities (e.g. milk, bread or refreshments) 1.3
Groceries and Health and Beauty Products (e.g. produce, meat or medicine) 1.1
Household Items (e.g. garden, office or pet supplies) 0.6
Durable and Discretionary Items (e.g. apparel, electronics or furniture) 0.6
SERVICES
Dining In or Taking Food Home (e.g. casual restaurant, fast food or take-out) 1.3
Personal Services (e.g. haircut, dry cleaning or nail salon) 0.7
Entertainment and Fitness (e.g. movies, bowling or gym) 0.4
Other Services (e.g. medical, financial or educational) 0.3
The survey data indicate that American adults make 3.7 trips per week on average for goods and 2.8 trips per week on average for services (6.5 weekly trips for both).[1] The types of goods for which individuals most frequently shopped were convenience items and necessities (1.3 times per week) and groceries and health and beauty products (1.1 times per week). Among the services, respondents indicated that they most frequently visit shopping centers for the food and dining options (1.3 times per week).
From a demographic perspective, the survey results were broken out by gender, age, geographic region, race, household income, household size, children in the household and education. Interestingly, the only demographic characteristics that seemed to meaningfully influence shopper frequency for either goods or services (or both) were age, race and the presence or lack of presence of children in the household.
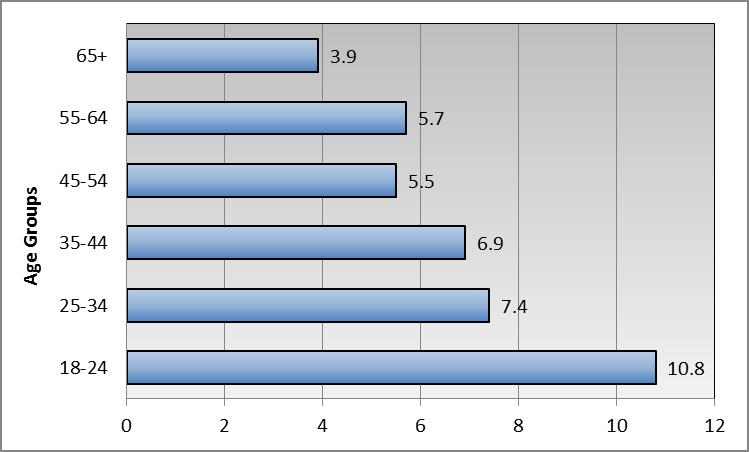
The most significant of these were the differences observed across age groups. When combining trips for both goods and services, 18-24 year-olds indicated that they make an average of 10.8 weekly visits to shopping centers. Among the 65+ age group, that figure is almost three times lower at 3.9 average weekly visits (see Figure 1).
Figure 1: Average Weekly Trip Frequency for Goods and Services by Age
Across races, Hispanics and blacks were far more likely to make weekly trips to a shopping center than their white counterparts. Hispanic adults indicated that they would make on average 9 weekly trips to a shopping center for goods and services compared to black adults at 8.3 times per week or white adults at 5.4 times per week.
As one might expect, households with a child or children under the age of 13 made far more weekly trips to shopping centers on average than did households with no children (8.5 trips per week versus 5.7 times per week).
Convenience Items and Groceries Dominate Weekly Spending
The survey also asked respondents about their spending habits when they visit a shopping center. The results indicate that individuals who visit a shopping center at least once a week spend on average almost $150 per week. This equates to spending of approximately $30 billion per week or $4.2 billion per day in shopping centers across the U.S.
This spending is being driven by targeted trips to smaller centers as demonstrated by the 97% conversion rate. That is, of those individuals that make at least one trip to a shopping center in a week almost all of them make at least one purchase.
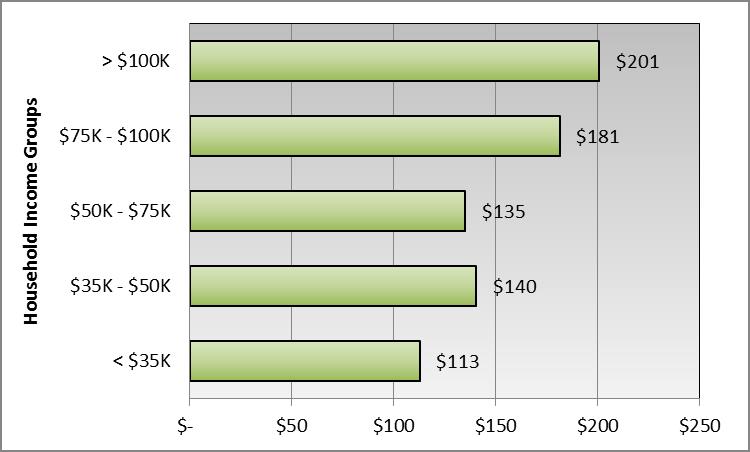
In the case of differentiating spending patterns, the most significant demographic characteristics are levels of household income and household size – particularly households with older children. For the lowest income group, households making $35,000 or less per year, average spending is just over $110 per week. At these levels, households are at the very least spending almost 17% of their annual income at shopping centers. For the highest income groups, households making $100,000 or more per year, average spending is far higher at just over $200 per week (see Figure 2).
Figure 2: Average Weekly Shopping Center Spending by Household Income
Among households with only one individual, average spending per week was just over $96 versus households with three or more people at around $173 per week. Households with no children indicated an average weekly spend of almost $130 versus households with any children reported spending about $183 per week. That number was slightly higher at around $193 per week for households with children between the ages of 13 and 17.
The survey also included a breakout of average weekly spending across four categories[2]:
Convenience items and groceries: $76.70
Household items and discretionary goods: $39.10
Restaurants, bars and take-out: $44.10
Entertainment, personal and other services: $27.10
Within these buckets, the data show that the households with the lowest levels of income spend considerably less on meals outside the home than do households with higher levels of income. Of the individuals who visit a shopping center at least one time a week for dining/drinking purposes, the lower income group spent only $28 per week on average compared to $66 for the high-income group (a spending ratio of 42%). Conversely, with respect to necessities like convenience items and groceries, the spending by the low-income group was a 67% of the spending by the high-income group ($64 per week versus $95 per week).
For households with children versus those without children, this effect is reversed. For groceries and convenience items, the households with no children are only spending 71% of what families with children are spending on average ($67 per week versus $95 per week). For restaurants and bars however, households with no children are spending $43 per week on average versus households with children who are spending $45 per week (a spending ratio of 95%). These examples illustrate the sensitivity of dining out to the availability of disposable income and time.
Shopping Centers Anchor Employment Base
The final questions in the survey asked Americans if they or any member of their household has ever worked in a retail, service or restaurant establishment located in a either an open-air shopping center or mall. The results indicate that one in three American adults (34%) has worked at shopping center at some point in their lives. No doubt this figure would have been higher had it included individuals under the age of 18.[3]
This result shows just how important shopping centers are to a locality’s employment base. These jobs are absolutely critical for creating and sustaining economic growth and productivity. These are, in many cases, first jobs, second jobs and part-time jobs, but they fulfill a critical need among a wide swath of the labor force.
They are also increasingly, good jobs. ICSC data indicate that over 20% of shopping center tenants are in higher-paying non-retail industries and include doctors and dentists, personal finance and tax professionals, and institutions of higher learning. Added to that are the almost 400,000 jobs needed for managing the day-to-day operations of retail centers nationwide.
Conclusion
Shopping centers are everywhere. There are over 115,000 in the U.S. alone and the vast majority of those (88%) are small neighborhood and convenience centers.[4] These locally-serving retail and personal service hubs are the anchors of thousands of communities across the country. They are the place Americans stop on their way home from work to get dinner’s missing ingredient or the go-to spot for a pizza party following a Little League win. And they are the places that create and support millions of jobs in the U.S. – 12.7 million by last estimate. These jobs and the incomes they provide are the lifeblood of local economic growth and prosperity. Shopping centers are inextricably woven into the fabric of American life and commerce and that is not likely to change anytime soon.
[1] The figures reported for the subcategories may not add up to the totals due to rounding differences in the underlying data.
[2] Among individuals who visited a shopping center for that specific good or service at least once a week.
[3] According to the Census Bureau’s 2014 Current Population Survey conducted on behalf of the Bureau of Labor Statistics, 15% of all cashiers and retail salespersons are between 16 and 19 years old. These two occupations alone, out of 840 in the Standard Occupational Classification (SOC) system, make up over 21% of all employment for individuals between the ages of 16 and 19.
[4] Based on ICSC’s shopping center definitions, a strip/convenience center has a gross leasable area (GLA) of less than 30,000 square feet and is typically anchored by a drug store or mini-mart. A neighborhood center has a GLA between 30,000 and 125,000 square feet and is typically anchored by a grocery store.