ICSC Insights & Intelligence
Survey conducted June 9-14, 2026
Executive Summary
Family-focused retail combines routine household needs with occasional treats. In an ICSC survey of parents and guardians of children ages 3-16, respondents report frequent visits and varied use of retail destinations, with a wide range of spending. Affordability and practical ease are considered foundational elements, and are the features parents most consistently chose. A broad mix of stores and age-appropriate experiences are additions worth testing, but are not guaranteed draws.
- Average spend figures conceal a wide expense range. Survey respondents report mean monthly spending of $466 on family-focused retail and experiences, excluding essentials, versus a $250 median. The gap suggests that a small number of high spenders pull the average up, so the median gives a better picture of what a typical parent spends.
- Frequent visits come with a broad mix of reasons for going to retail destinations. Fifty-seven percent report visits with children at least weekly and 95% at least monthly. Among the 997 respondents who report visiting these destinations with their children, everyday needs are the most commonly selected reason, alongside dining, entertainment, errands, socializing and children’s activities. Because responses overlap, the survey does not show which purposes occur during the same visit.
- When children take part in the destination choice, reported spending fluctuates with that role. Among those 997 respondents, 16% say children mostly decide, 46% describe a shared decision and 37% say an adult mostly decides. Mean reported monthly spending is $559, $477 and $420, respectively. These figures show a link, but they do not prove that greater influence by children necessarily causes higher spending.
- Value and ease are the foundation; experiences are additive. Affordable prices are the most selected destination feature, at 68%; 79% say regular family-focused events or activities would make them more likely to visit. The pattern has two parts: affordability and ease appear to come first, with experiences suited to the audience and occasion viewed as additive.
The practical approach is to treat affordability and ease as the starting point, then test the additions in order: first a mix of stores and services that makes it easy to get several things done in one trip, then regular events, then programming tailored to different ages and households. Clear value and easy access are the foundation that test builds on.
The mean masks a wide spending distribution
Survey respondents report spending a mean of $466 per month on family-focused retail and experiences, excluding essentials. The median is $250. That $216 gap points to a small group of high spenders pulling the average above the midpoint.
This distinction matters for decisions. The $466 mean describes the sample average, but it should not be presented as what the middle respondent reports. The $250 median better represents the sample midpoint. The gap and wide range show why an offer, price threshold or budget set only to the average could miss what many parents are actually willing and able to spend.
A majority of respondents (61%) say they spent more on family-oriented retail, items or activities than they did 12 months earlier; 24% report spending about the same and 16% report spending less. The survey cannot separate higher prices from buying more, changing needs or a different mix of purchases, so this reflects what parents say they spent, not proof that they bought more.
For retail destinations, this points toward a range of price points rather than a single “family” price. Operators can test a clear, low-priced core offer plus optional upgrades or experiences against different spending levels. Tracking the median and the full range of spending, not just the average, will make this easier to evaluate.
Frequent visits support a broad mix of retail purposes
Family-oriented visits are embedded in many respondents’ routines. Fifty-seven percent report visiting shopping centers or retail districts with their children at least weekly, and 95% report visiting at least monthly. These results show that the parents surveyed visit retail destinations often.
Shopping patterns suggest that no single retail format meets every need. Among the 997 respondents who ever visit, 65% select mixed-use shopping centers, 51% enclosed malls, 47% open-air shopping centers and 38% downtown or business districts.
This variety also shows up in the reasons parents give for visiting. Among those 997 respondents, 67% select everyday needs or essentials; respondents also select dining (38%), entertainment or experiential activities (37%), errands or appointments (34%), necessity or convenience (31%), socializing (27%) and children’s activities or classes (22%). These responses overlap. They are not a breakdown of visits and do not show which activities happened on the same trip.
Likely spending also reaches beyond stores. Among those 997 respondents, 65% select retail stores as a category on which they are most likely to spend, 57% select dining and treats, and 48% select entertainment venues. Services, activity-based retail, educational or enrichment offerings, childcare or play spaces, and events also register. The chart compares distinct household groups based on the ages of their children, and shows that retail remains the most selected category in each of the three broader groups.
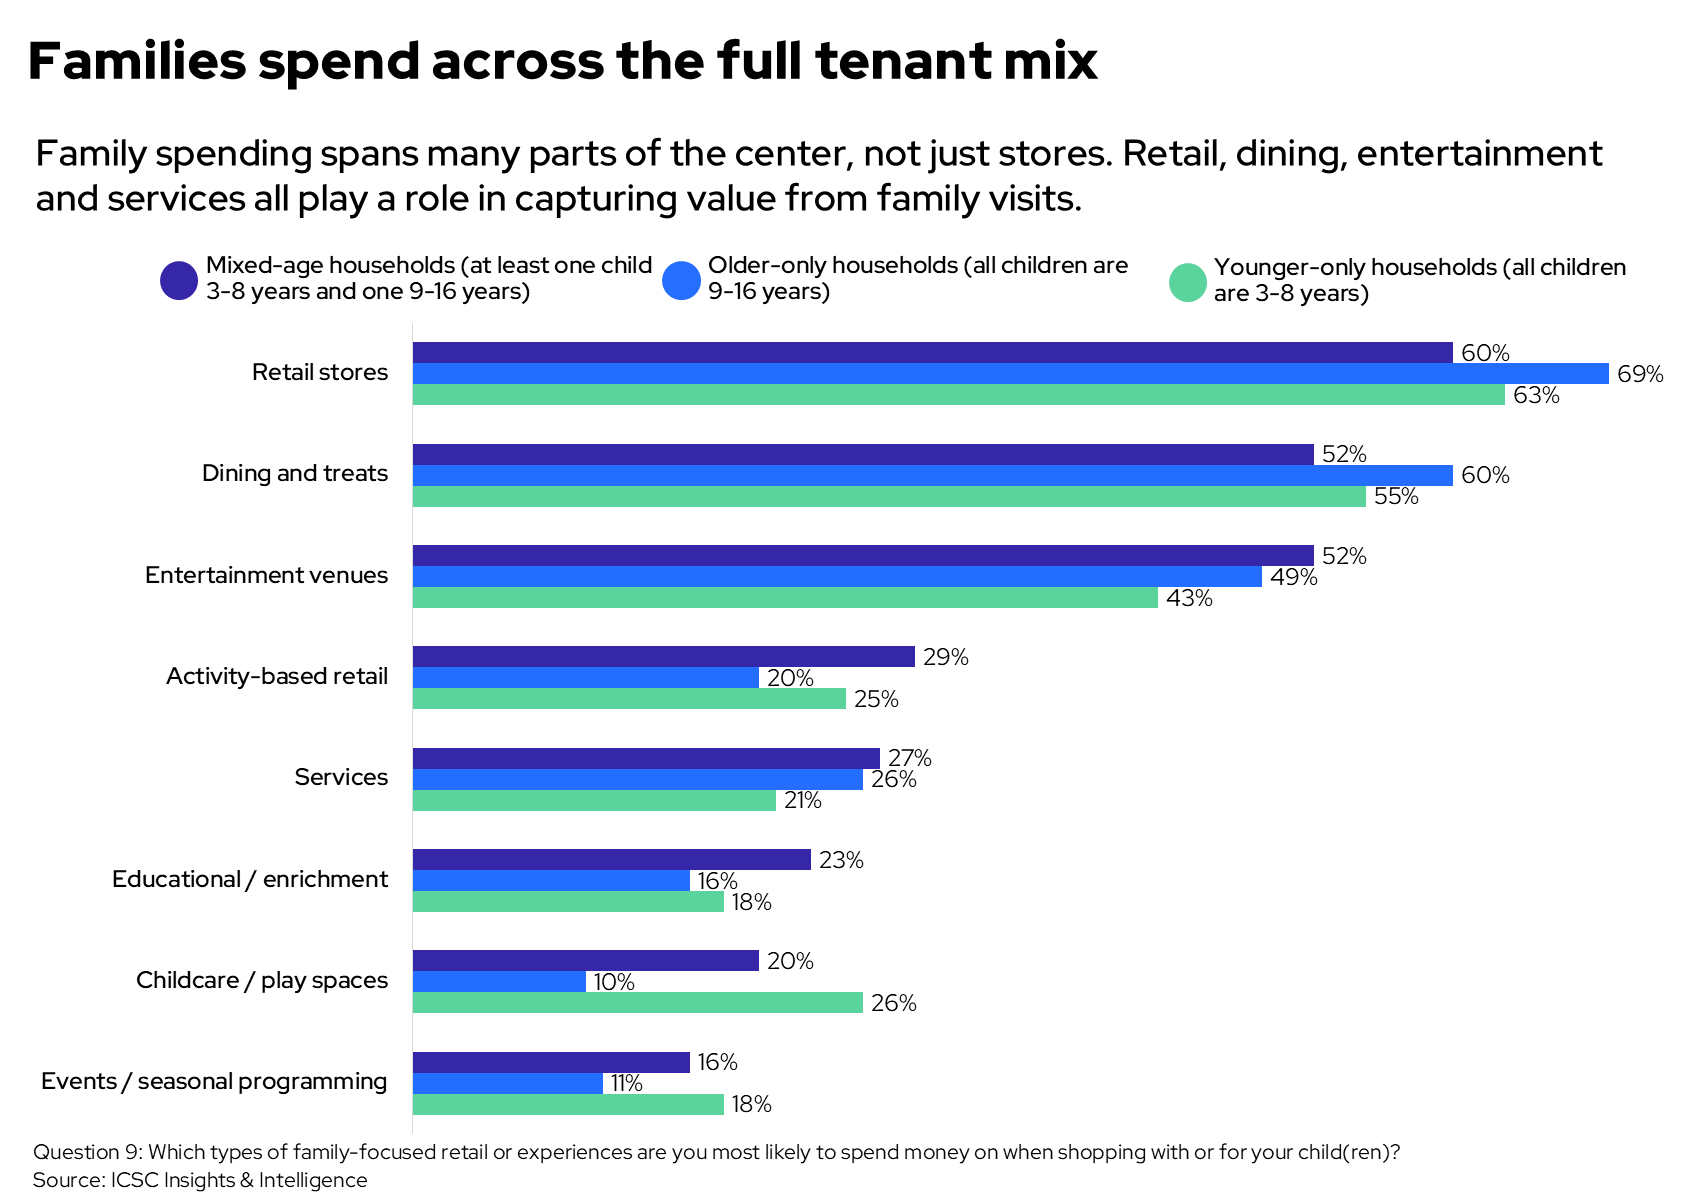
Figure 1: Retail and experience categories surveyed parents say they are most likely to spend money on, by mutually exclusive child-age household type.
The range of reported purposes and spending categories supports the idea that a complementary mix of stores and services are important factors in deciding where to visit as it may make it easier for a family to get several things done in one trip.
Value and ease are the foundation; experiences are additive
When asked to choose any and all features that make a shopping center more appealing for family visits, 68% of respondents select affordable prices. Practical amenities, gathering spaces, dining, access and experiential features also register, as the figure shows.
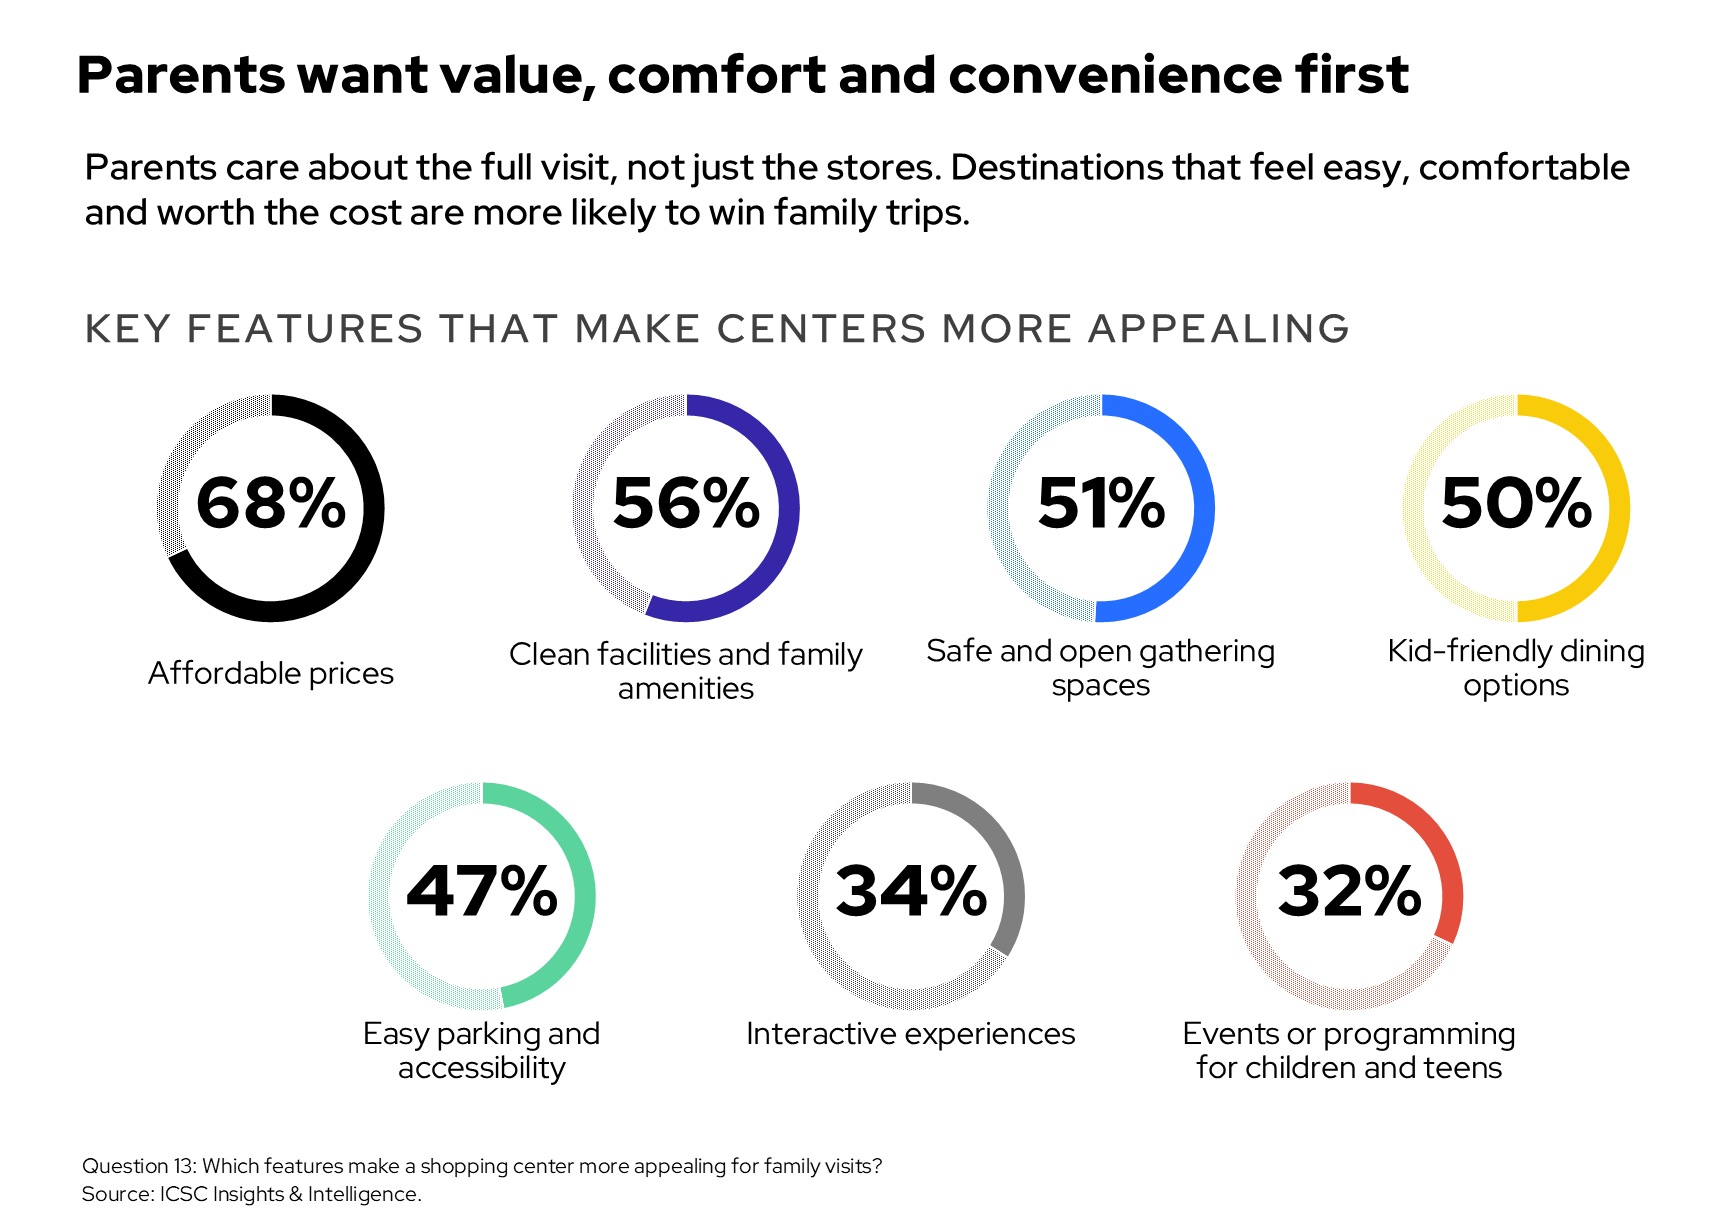
Figure 2: Features surveyed parents say make a shopping center more appealing for family visits.
This pattern suggests an order for testing, not a proven ranking of what matters most. Experiences appear to matter alongside the basics that more parents selected; a good reason to spend time at the destination may help it stand out once those basics are in place.
Two related findings measure different parts of that choice. Among the 997 respondents who report visiting these destinations with their children, 86% say the availability of family-friendly experiences has a major or moderate influence on where they choose to shop. Among all 1,004 respondents, 79% say that “regular family-focused events or activities” would make them more likely to visit. The first is about choosing where to shop; the second is how parents say they would respond to an offer that does not yet exist.
Attention to value also shows up in what parents report doing. Ninety-four percent report using at least one listed way to save money when spending on their children. Deals and promotions are selected by 67%, online price comparison by 51%, coupons by 42% and shopping across stores or live price comparison by 39%. This suggests events and programming work best tied to clear value rather than run separately: predictable pricing, clear offers and free or low-cost activities can make the value easier to see.
Reported spending is linked to who has more say
Mean reported monthly spending increases with children’s influence over purchase decisions: $420 when an adult mostly decides, $477 when the decision is shared and $559 when children mostly decide. Importantly, this ranking simply describes the pattern; it does not prove that one causes the other.
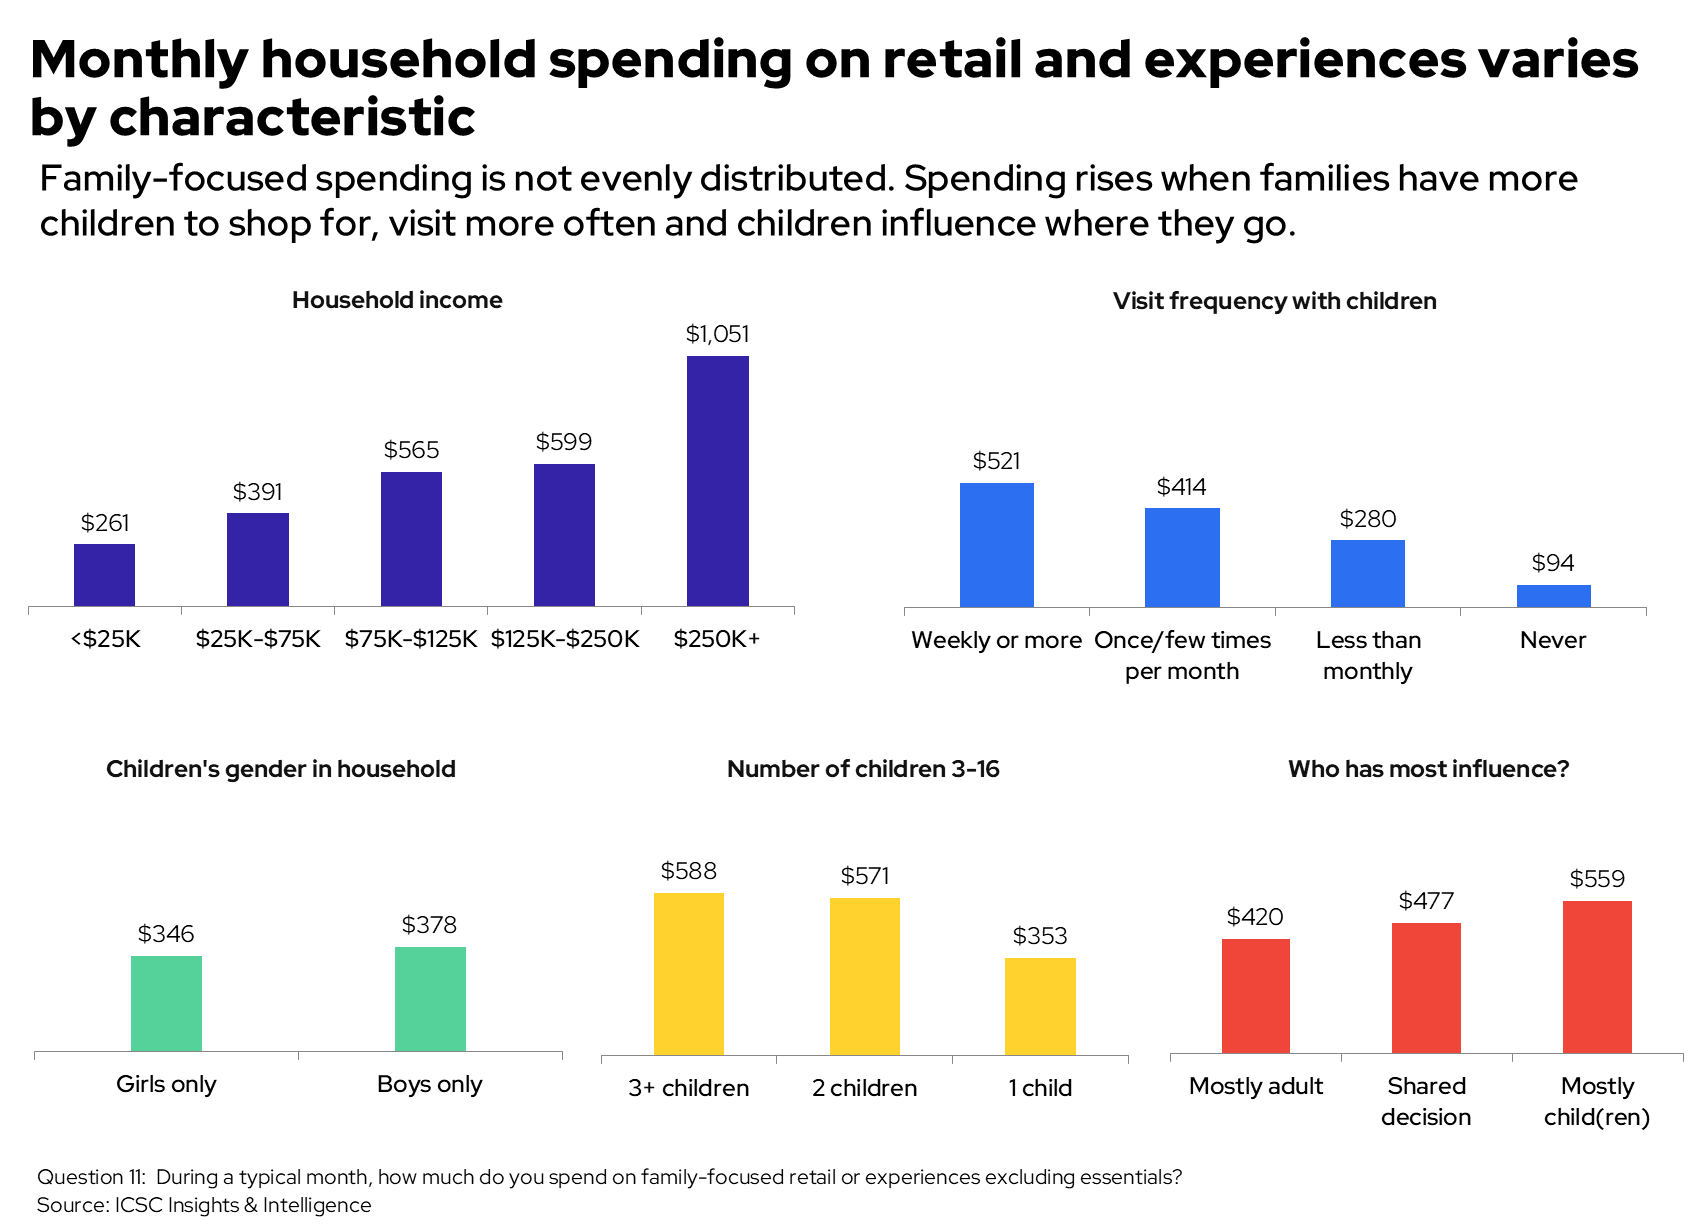
Figure 3: Mean reported monthly spending on family-focused retail or experiences, excluding essentials, by selected household and visit characteristics.
Parents also report that their children often make requests, and that they often spend more than planned because of their children. Among the 997 respondents who report visiting shopping centers or retail districts with their children, 60% say their children request specific stores, restaurants or experiences almost always or often. Fifty-four percent say they spend more than planned because of a child’s influence almost always or often.
The point is that more than one person shapes where a family goes. Adults are still part of the decision, while children can influence where the family goes and add unplanned items to the basket. Retailers and operators can respond to both roles through age-appropriate ways to explore, clear prices and experiences that are easy for adults to judge. That approach can make a destination more responsive without relying on child pressure as a lasting way to grow sales.
Reported interests and spending profiles vary by household age mix
Looking at reported interests across the distinct child-age groups highlights differences between households with younger children, older children and children spanning multiple age ranges.
Among households with children ages 3–5 only, 67% report interest in hands-on creative activities, 57% in themed experiences, 31% in gaming or virtual reality and 25% in influencer- or brand-related pop-ups. Among households with children ages 15–16 only, the corresponding figures are 38%, 37%, 46% and 34%.
Households with children spanning multiple older age groups and those with both younger and older children report interest across several categories.
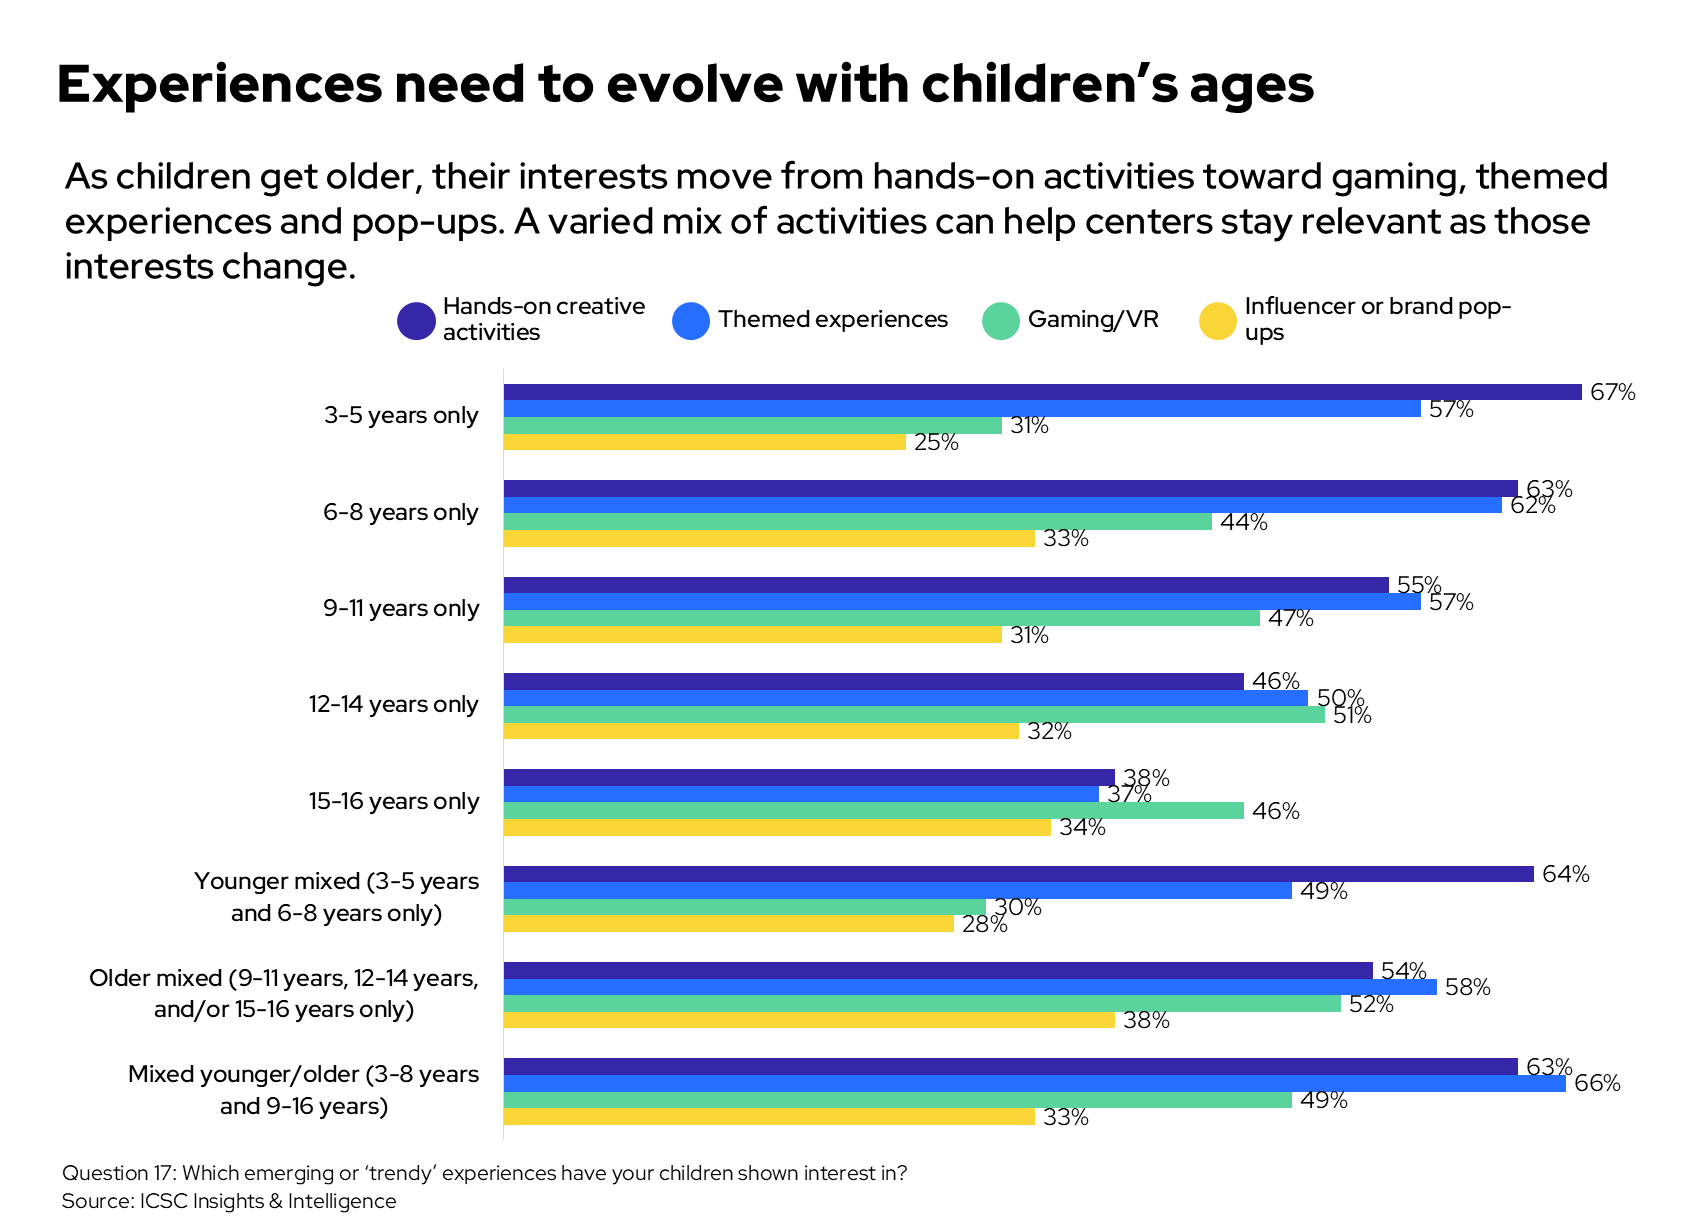
Figure 4: Emerging experiences children have shown interest in, by mutually exclusive child-age household group.
In this sample, the ages 3–5-only group leans toward hands-on and themed activities; the ages 15–16-only group is spread more evenly and includes gaming or virtual reality at 46%. Mixed-age groups report interest across several categories. Because preferences vary by age not only in degree but also in type, programming tailored to different age groups may fit better than a single format.
Reported average spending also varies across these separate age groups. The means range from $303 among households with children ages 9–11 only to $624 among older mixed-age households; households spanning younger and older children report a mean of $607. These raw averages do not prove that age mix causes higher spending. Likely, a household’s makeup is a useful planning factor to weigh alongside income and how often the family visits.
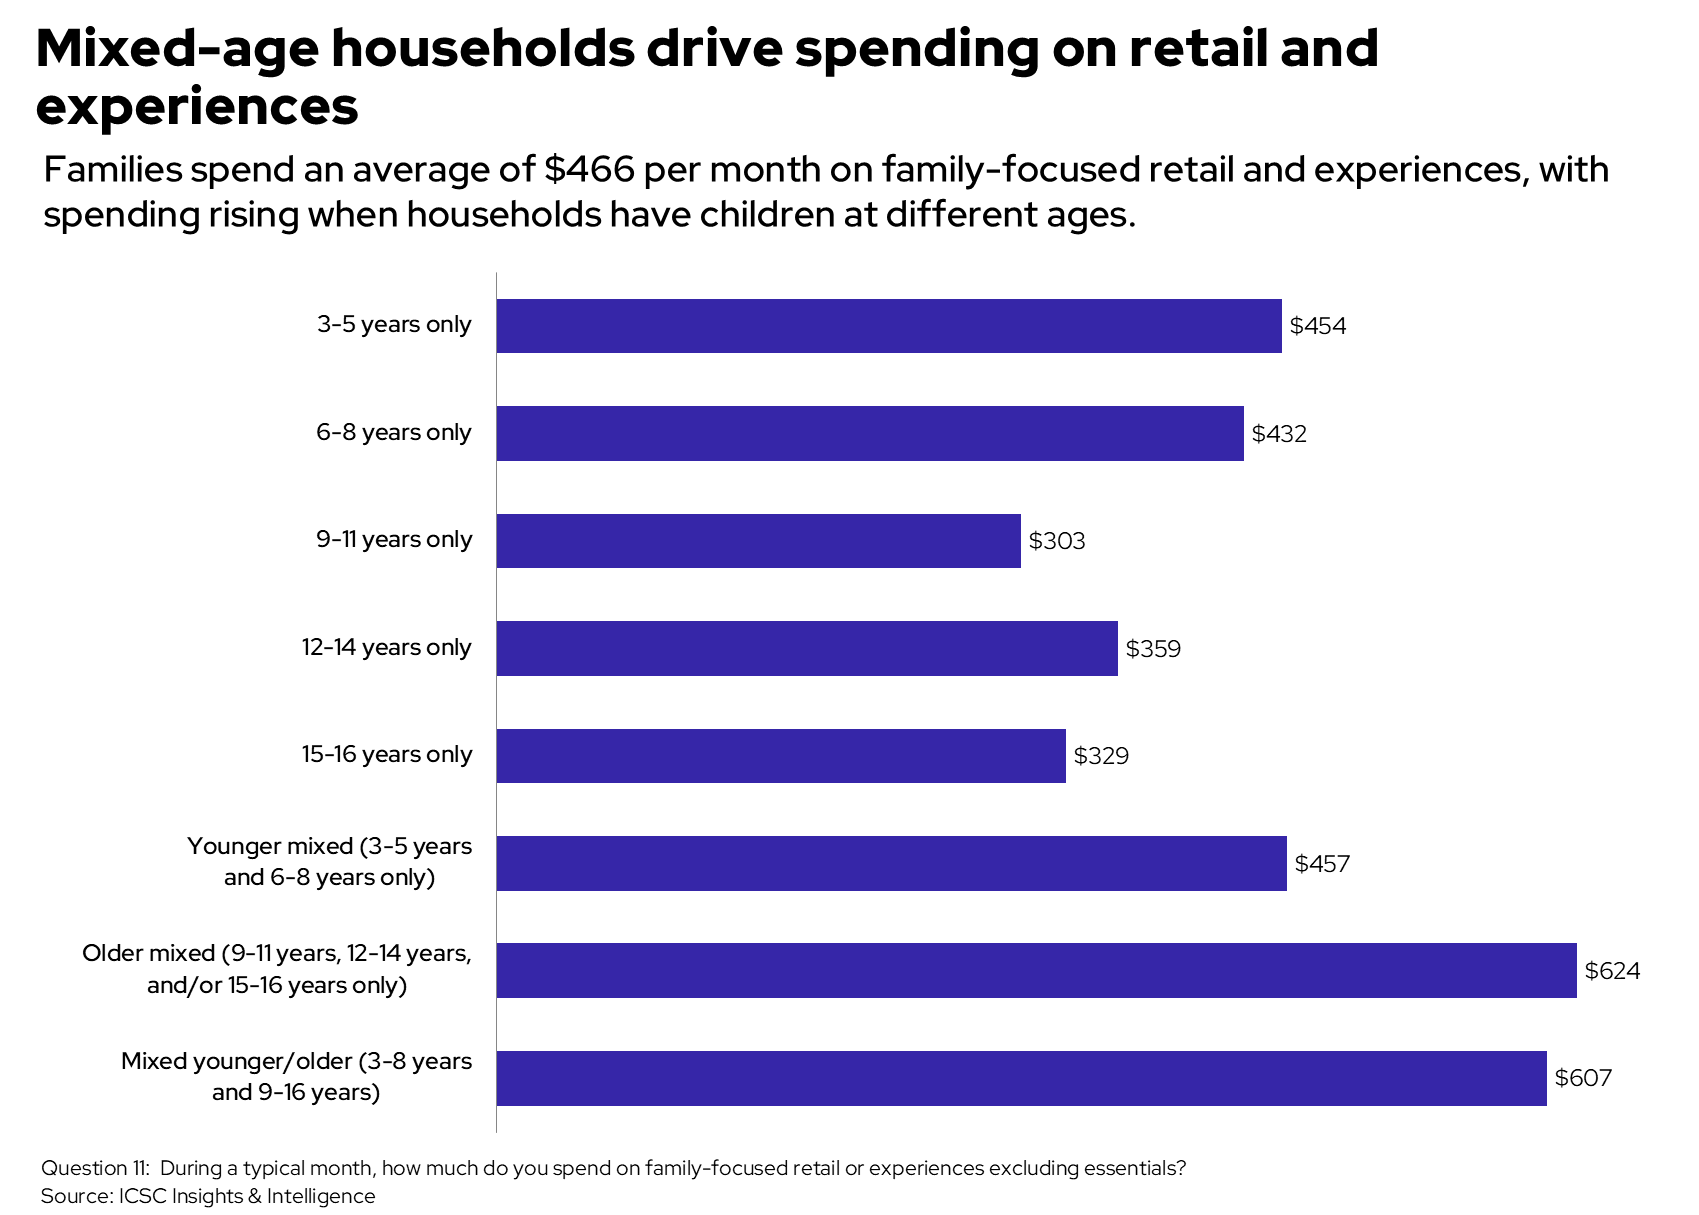
Figure 5: Mean reported monthly spending on family-focused retail or experiences, excluding essentials, by mutually exclusive child-age household group.
In practice, a regular calendar can combine activities for different ages, let siblings take part in nearby activities and give adults clear information about cost, length and supervision. Success then shows up in the types of households actually reached, rather than in treating all parents as one group.
Reported spending intentions across income groups
Plans for the next year are spread out within every income group shown. At the two ends of the range shown, 24% of respondents reporting household income below $25,000 plan to increase overall family-focused spending, 27% plan to shift more toward essentials and 17% plan to decrease overall spending. Among those reporting $125,000–$249,999, the corresponding shares are 39%, 22% and 5%. The chart shows the full breakdown, including shifting more toward experiences, no major change and being unsure.
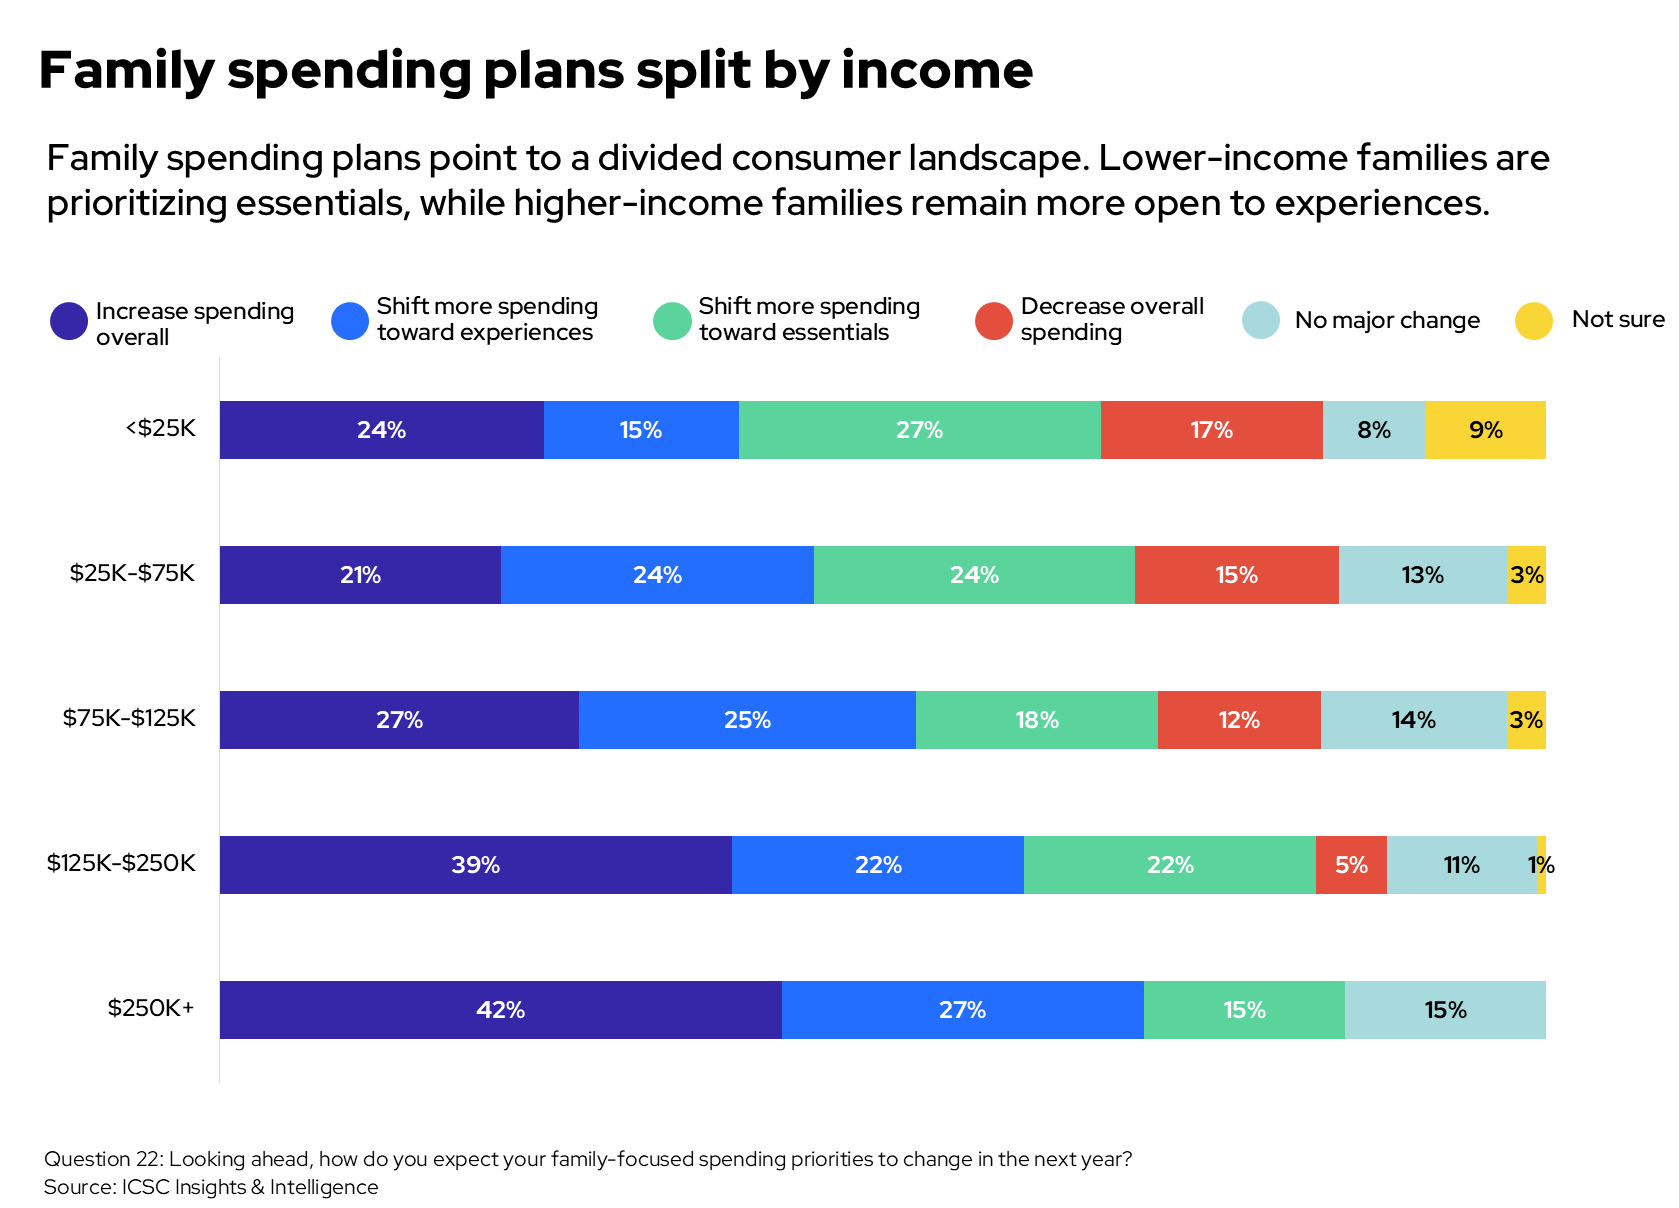
Figure 6: Expected changes in family-focused spending priorities over the next year, by household income.
The pattern is not a single upward trend and the spread within each group is the key finding: unlike a household’s age mix, income does not predict which way a household plans to move, which makes it a weak basis for shaping offers.
These are stated intentions, not observed changes in spending, so they cannot be directly attributed to inflation or broader economic conditions. Although planned spending priorities vary by income, the results do not necessarily call for a separate offer for every income group. A more practical response may be a flexible offer: an affordable core with optional experiences available at different price points, frequencies and scales, allowing families across budgets to choose what fits. Clear value messaging would help families understand what is included, what is optional and what the trip is likely to cost.
Why this matters
Protect the economic foundation of the trip. Affordability is the floor, not one option among several. Affordable prices are the single most-selected feature (68%), and looking for value runs through the whole sample: 94% of parents report using at least one way to save money. Clean facilities, safe gathering space, suitable dining and accessible parking are widely selected alongside price. In short, parents weigh the full cost of the visit in both time and money, not only the price of an event or product, so this is the precondition the rest of the offer builds on. The remaining opportunities are ideas to test, in roughly this order of current support:
Design the destination around a portfolio of reported purposes. First, a mix of stores for the trip that address several purposes. Parents already use several types of destinations and expect to spend across retail, dining and entertainment, so this idea rests on what they already do. That variety suggests, but does not prove, that coordinated hours, easy-to-follow signage and a balanced mix of stores make visits smoother and encourage spending across categories.
Use experiences as targeted, testable additions. Stated interest in relevant experiences is high: 86% say family-friendly experiences influence where they shop and 79% say regular events would make them more likely to visit. But these are opinions about an offer that does not yet exist, not guaranteed visits, which is why they rank behind the mix of stores. Their effect is easier to read when each event’s audience, value and frequency are set out, and when attendance, extra visits, purchases, repeat visits and cost per household reached are measured against a realistic baseline.
Design for household variation. Children’s ages and who makes decisions shape different needs and interests, which points toward flexible experiences and price points, prices and practical details that are clear to adults, and age-appropriate things for children to explore. This is more a way to focus the first two ideas than a program on its own.
Taken together, value and practical ease form the foundation, while the mix of stores and experiences and greater tailoring to household needs are areas to test and refine. The limits of the evidence matter just as much. The survey describes attitudes, reported behavior and stated intentions within the group surveyed.
Methodology
ICSC’s Family-Focused Retail study was conducted online June 9–14, 2026, among 1,004 qualified U.S. parents or guardians of children ages 3–16. Results in this report describe the parents surveyed and should not be treated as representative of all U.S. parents or families.
The total number of respondents is 1,004. Findings in this report about visiting formats, visit reasons, destination influence, child requests, unplanned spending and spending categories use the 997 respondents who reported ever visiting shopping centers or retail districts with their children. Other findings use the full sample unless noted. Question wording and answer options vary; questions that allowed more than one answer can add up to more than 100%. Displayed percentages may not total 100% because of rounding.
Source: ICSC Insights & Intelligence, Family-Focused Retail survey, June 2026.