ICSC Insights & Intelligence
Consumer Economy Report
Survey conducted July 29-31, 2026
ICSC’s summer survey shows that consumers are still participating in the market, but doing so under tighter constraints. Higher prices and new expenses, not looser household budgets, remain the main reasons for increased spending. Consumers are still buying, but necessities, value and a clear reason to purchase increasingly guide their choices. This report presents ICSC survey findings alongside current economic data that provide context.
Executive Summary
- Higher spending does not necessarily mean stronger demand. Seventy-seven percent report higher monthly spending, but elevated prices and new expenses are the primary spend drivers, while only 14% cite higher income. Across ICSC’s spring and summer surveys, about three-quarters reported spending more, though fewer pointed to higher prices as the reason for the increase.
- Consumers are choosing more carefully. Similar to results in the spring, about half say they are spending about the same but are being more selective. Trading down, delaying purchases or skipping them altogether are much more common than spending freely. This pattern appears across income groups, although lower-income households are more likely to stop or delay purchases.
- Essential costs limit what remains for nonessential spending. Essentials account for about 71% of monthly budgets. Even households covering their essential expenses often cut nonessentials, save less, draw on savings or use credit. More than half of these households would reduce nonessential spending if monthly essential costs were to increase $249 or less.
- The outlook for nonessential spending has improved since late winter, but growth is concentrated. Consumers remain open to purchases that offer value or usefulness or fit a plan or occasion. However, dining, travel and luxury spending expectations weakened after the spring and households earning $125,000–$250,000 show the broadest strength in discretionary spending.
Higher spending is not the same as stronger demand
The summer survey measures financial pressure as well as spending activity. Seventy-seven percent of adults say monthly spending increased, yet the dominant explanations are higher prices and new expenses. Higher income and greater financial security are far less common. A household can spend more without buying more, upgrading purchases or feeling better able to absorb the cost.
That distinction persisted through much of the year. The share reporting higher spending stayed near three-quarters throughout spring and summer, while the share of those spenders blaming higher prices declined from 72% to 60%. New expenses stayed close to 30%. Among consumers spending less, cutting their nonessential purchases remained the primary way to reduce spending, a behavior that grew from spring to summer. Together, these shifts suggest that price pressure has not disappeared. Instead, households are making clearer choices about what to protect and what to cut. [1, 2, 3]
Separate economic data show that consumers are still spending. Real consumer spending rose 0.4% from May to June, according to the U.S. Bureau of Economic Analysis, while retail and food-services sales remained higher than a year ago. These figures show continued spending, but not a broad surge in demand. The ICSC survey provides context: consumers are still spending, but choosing purchases more carefully and setting tighter priorities. [4, 5]
Importantly, an unchanged spending total does not mean buying habits stayed the same and can mask substantial shifts among categories. Among adults whose monthly total held steady, the leading explanation was choosing purchases more carefully, followed by balancing increases in some areas with decreases in others.
Consumers are being more selective
Choosing more carefully is becoming standard. Nearly half of consumers say they are spending about the same but being cautious. Trading down, delaying purchases and skipping them are much more common than spending freely. Continued spending does not guarantee the same basket, brand, retailer or timing.
Income affects how consumers adjust. Higher-income households are more likely to maintain purchases while comparing value; lower-income households are more likely to delay purchases. Consumers earning below $75,000 are nearly twice as likely as those above that threshold to delay or skip purchases, although careful purchasing is common above and below that income level.
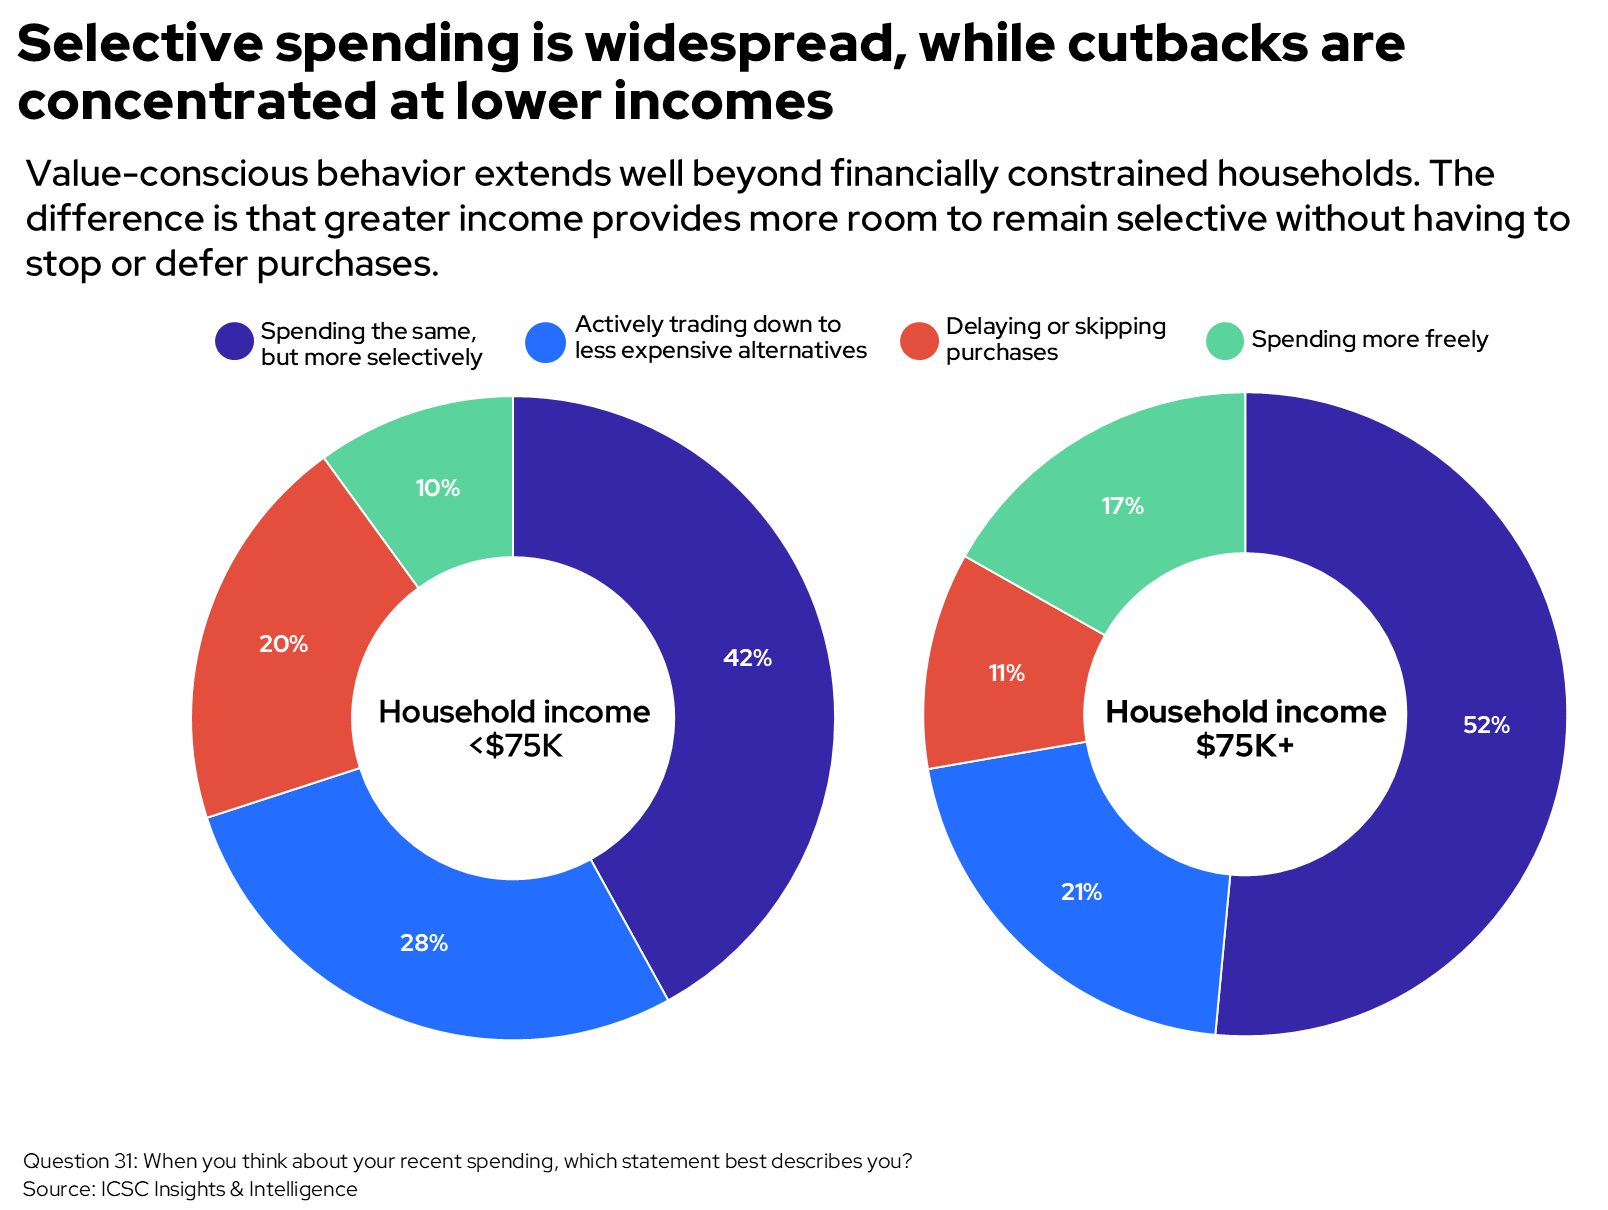
Figure 1. Recent spending behavior by household income.
Looking ahead, 72% say they plan to be more selective over the next three months. They expect to manage their budgets in several ways: fewer everyday discretionary purchases, shifts to lower-priced brands or retailers, heavier use of discounts and less big-ticket spending. This matters because a promotion may preserve a sale without preserving loyalty; a value-conscious consumer may still switch retailers, product tiers or categories.
Value does not always mean the lowest price. Nearly one in five plan to buy fewer but higher-quality items, and many nonessential purchases still depend on usefulness or utility for a specific occasion, thereby meeting a clear need.
Separate sentiment data point to the same caution. The University of Michigan’s July sentiment index improved from June but remained below a year earlier, showing that expectations can improve before households feel materially better about their purchasing power. Consumers can therefore remain engaged while still protecting budgets. [3, 6]
Essential costs limit discretionary spending
Essential expenses anchor household budgets. Consumers estimate that essentials account for roughly 71% of monthly spending, and they anticipate those costs to continue to rise. That leaves a smaller share for nonessential spending and makes it the first place many households look when recurring costs rise.
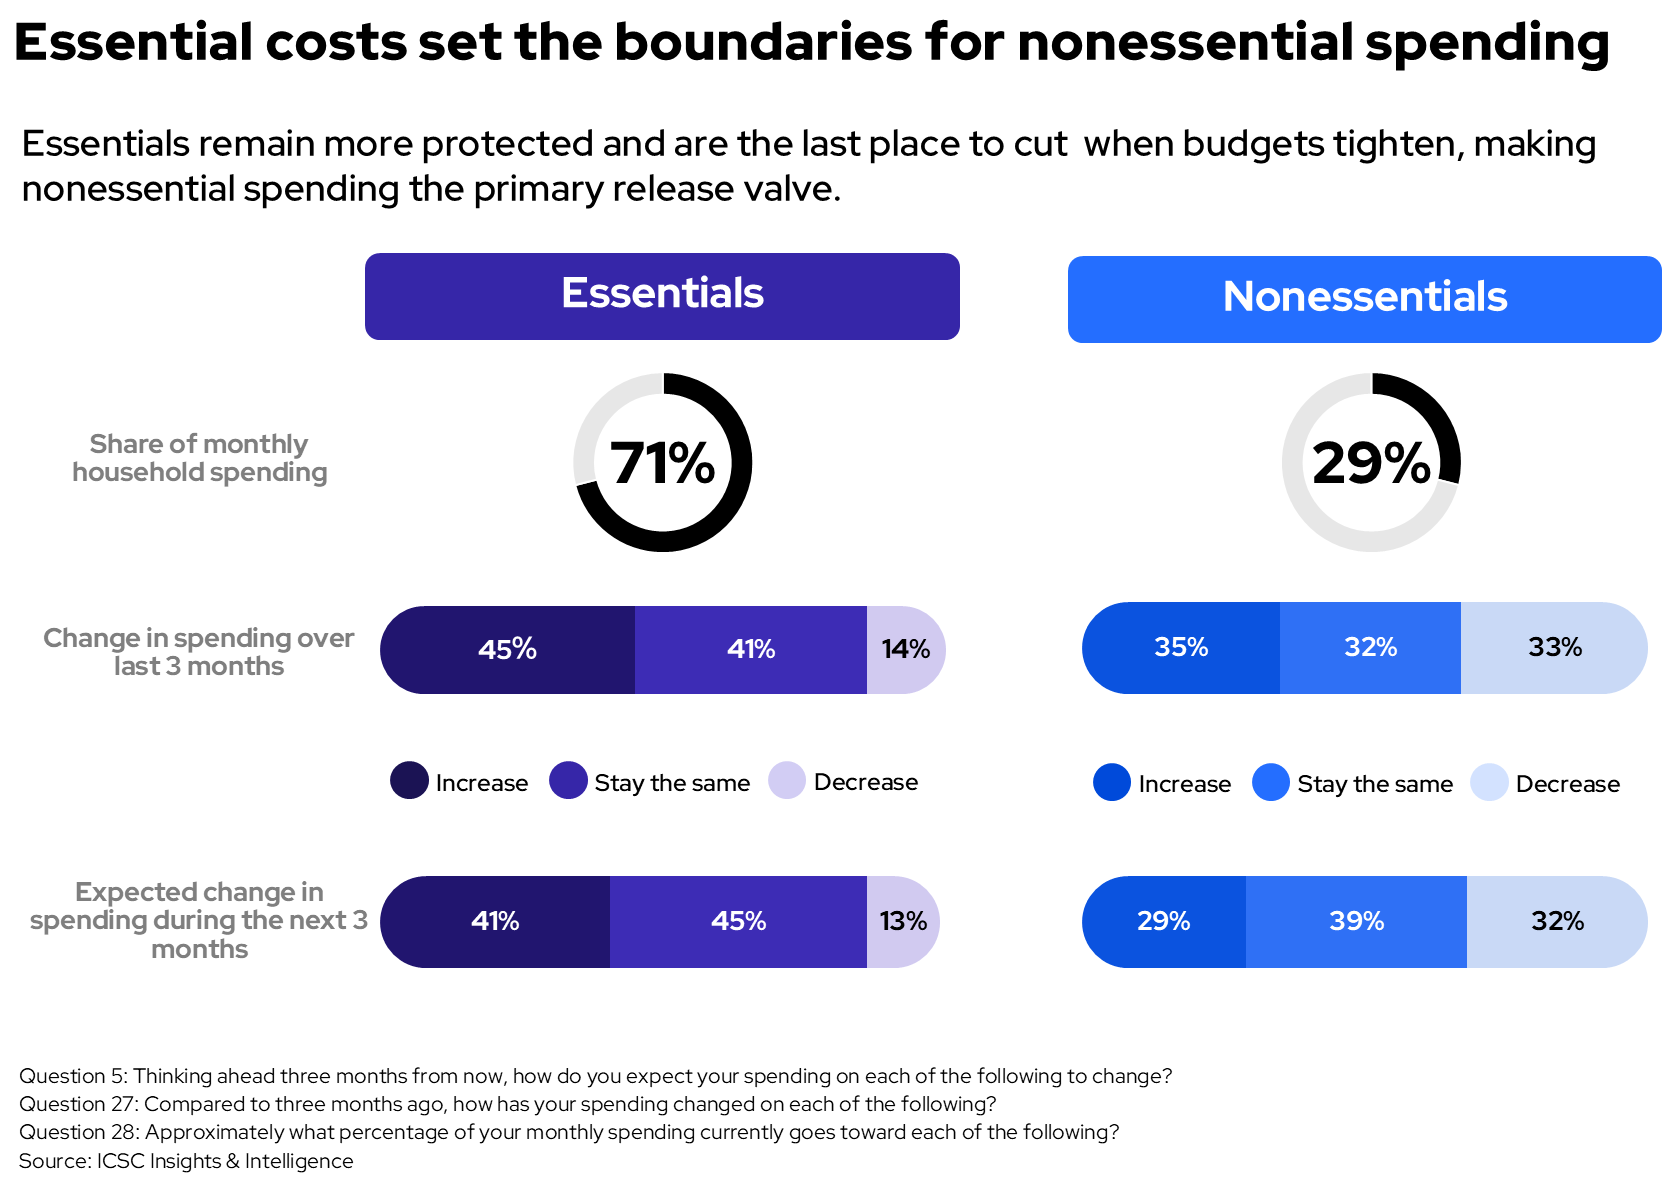
Figure 2. Essential and nonessential spending allocation, recent change and expected change.
More spending on essentials does not necessarily signal stronger household finances. Consumer prices remained 3.4% higher than in July 2025. Energy prices were especially high: gasoline had declined for two months but was still 24.6% higher than in July 2025, while shelter costs were 3.2% higher and groceries cost 2.7% more than a year ago. These separate price data help explain why fewer consumers may cite prices as the main reason for higher spending even as they remain selective. Some prices are easing, but they remain high enough to limit nonessential purchases. [7]
Cutting essential spending appears to signal broader financial pressure. Among consumers who expect to reduce essential spending over the next three months, 77% also expect to cut nonessential spending. Grocery spending provides an example of that pressure: 57% of consumers expecting grocery and everyday-essential spending to rise also expect to reduce at least one discretionary category, such as dining, travel or luxury goods.
Outlook for nonessentials improved, but growth is concentrated
The overall outlook for nonessentials has improved since winter. The share expecting to spend more rose from 22% to 29%, while the share expecting to spend less declined from 38% to 32%. Overall expectations were less negative, but not every category improved. [3, 8]
The outlook across categories, including nonessentials, is more limited and uneven. Groceries remain positive across income groups, while luxury and premium goods remain under pressure across the board. Apparel, beauty and selected experiences are stronger among households earning more than $75,000, and the $125,000–$250,000 segment shows the broadest discretionary strength. Even there, however, the gains are concentrated rather than widespread.
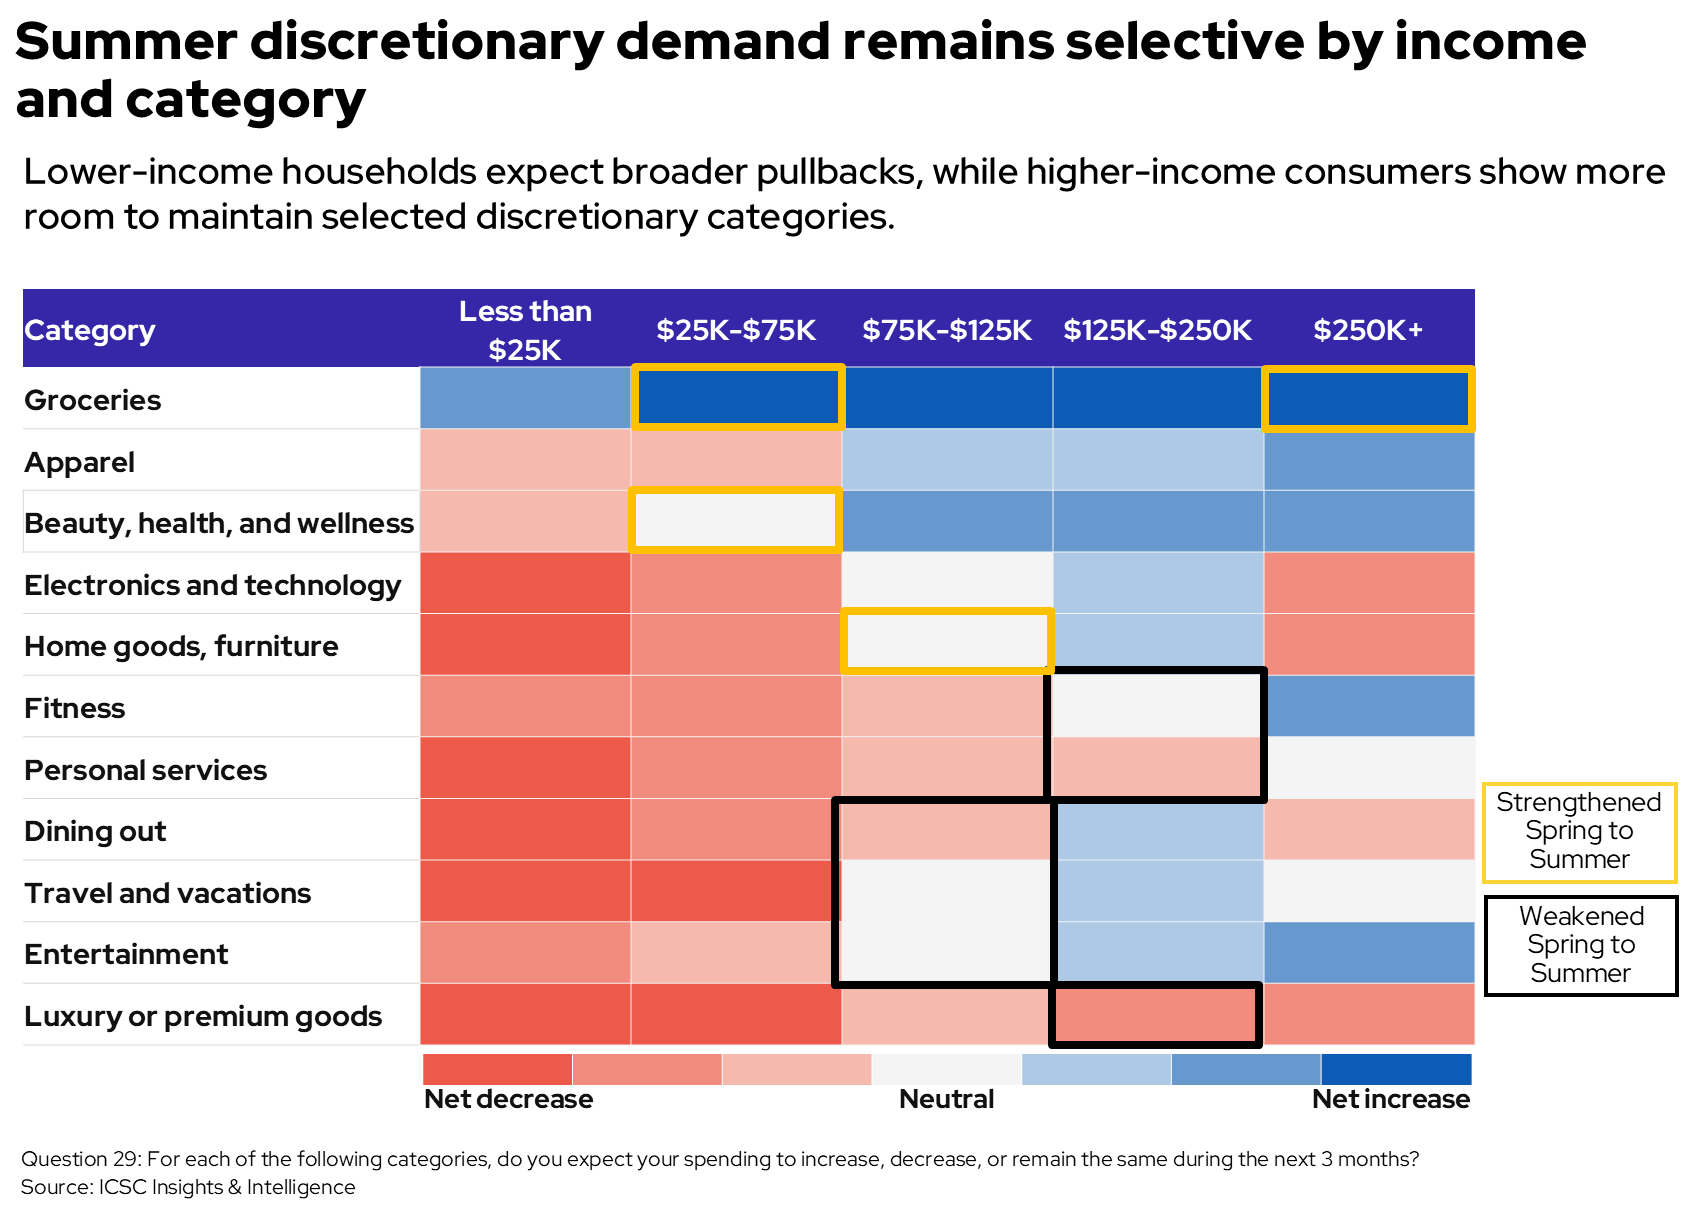
Figure 3. Summer category-level spending expectations by household income, with selected spring-to-summer changes highlighted.
The survey also shows that purchases still depend on clear reasons to buy. Eighty-two percent can identify a reason they would consider a nonessential purchase, and roughly seven in 10 of those expecting an overall cut still identify a reason to buy. Value, usefulness, planning and occasion can preserve demand, but reasons to spend vary by consumer and purchase. The heat map shows relative pressure, not a sales forecast.
If conditions worsen, consumers expect targeted cutbacks
Consumers say they would not cut every category equally if conditions worsened, and would cut experiences and discretionary goods first, led by dining, leisure, travel and premium purchases. Necessities are more often protected or downgraded rather than eliminated, while savings and debt repayment rank lower on the list.
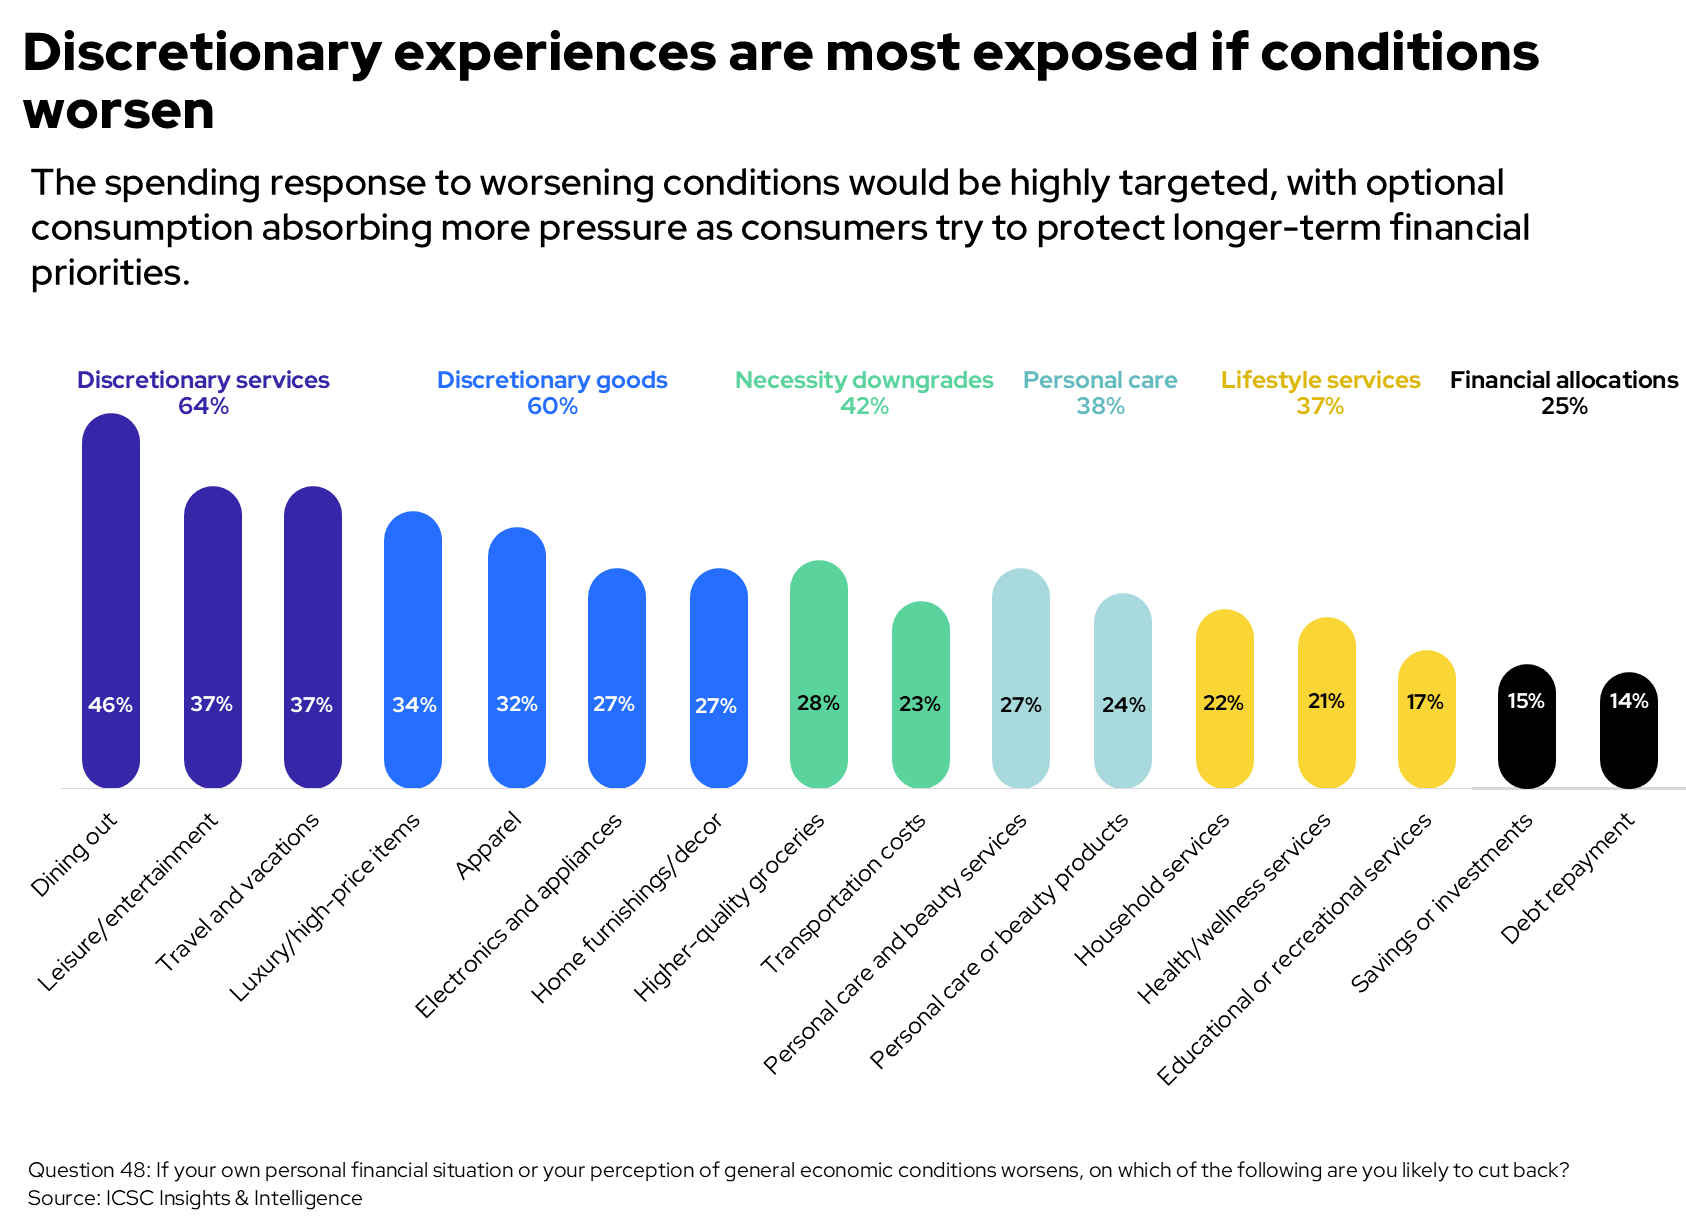
Figure 4. Categories consumers say they would cut if their finances or their view of the economy worsened.
This order suggests consumers may protect basic needs and financial goals until pressure intensifies, cutting optional categories first. Business exposure would therefore depend heavily on category and tenant mix, not only on overall consumer spending.
Cuts vary by generation. Younger consumers show a more mixed pattern across goods and personal care, while older consumers lean more toward experiences such as dining, leisure and travel. A weaker environment would not produce a uniform response across age groups.
Because the question is hypothetical, it does not forecast actual sales. It instead shows the order in which consumers say they would reduce spending: optional, high-priced purchases that can be delayed face greater pressure, while essential and longer-term financial commitments rank lower on the cutback list.
Financial cushions divide households
The sharpest divide in the survey is not between spenders and non-spenders. It is between households with and without room to absorb a shock. Seventy-seven percent say they are keeping up with essential expenses. Of them, 61% are keeping up without reporting any debt or borrowing-related strategies. Yet among those keeping up with their necessary expenses, 45% still have little left for things they want. Payment status identifies distress only after it becomes severe; it does not fully measure financial comfort.
Separate national credit data show the same strain. U.S. household debt remained near $18.8 trillion in the second quarter, while credit-card repayment stress remained elevated. Serious credit-card delinquency has risen from the unusually low levels of 2022, while the rate at which new balances became seriously delinquent was broadly stable in the second quarter. [9]
The survey shows what may happen before payment problems emerge. Many report cutting nonessentials, working more, saving less, using savings, carrying credit-card balances or making only minimum debt payments. These strategies preserve current payments but can reduce future flexibility. A household can look stable today while becoming more exposed to the next expense. Only about a third of households keeping up can cover expenses with regular income alone.
High credit costs add another constraint. In the second quarter, credit-card accounts carrying interest averaged rates above 22%. Credit can help households stay current today, but those costs can reduce the income available for future spending, essentially postponing financial pressure rather than eliminating it. [10]
Savings show how exposed households are. Just over half are currently saving, which includes consumers saving less than usual. Others are using savings for essentials or report having no savings at all. Among adults without savings, 60% are unable to keep up with essential expenses, compared to 14% among those with savings. The gap suggests that savings, not only income or current spending, are central to financial stability.
Separate economic data also show that households are saving less. The U.S. personal saving rate fell from 3.8% in February to 2.7% in June, so households overall set aside a smaller share of disposable income. The rate does not measure any individual household's existing savings, but it provides context for the survey: consumers may be keeping up with current expenses while having less capacity to rebuild savings for future expenses. [4]
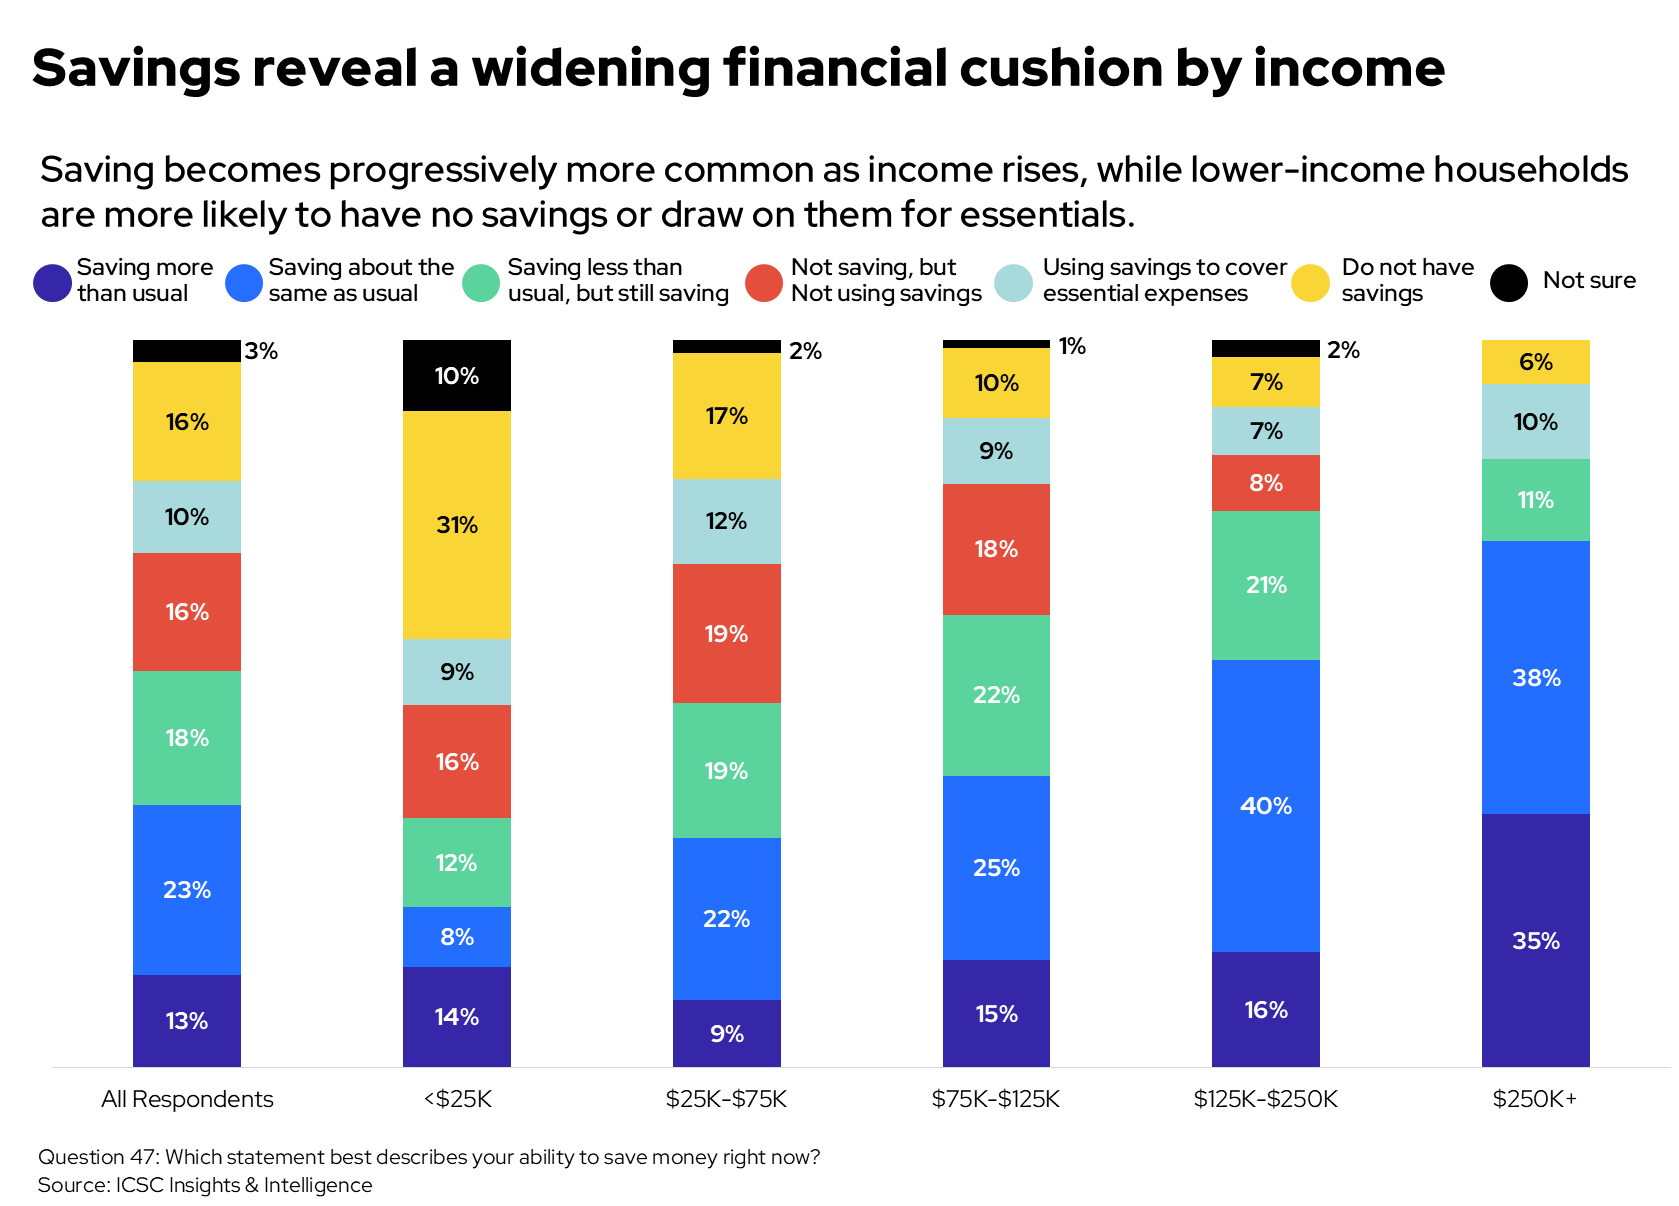
Figure 5. Consumers’ ability to save by household income.
Income affects every part of this financial cushion. Only 56% of households below $25,000 are keeping up with essentials, compared with 90% or more above $125,000. Current saving and confidence rise sharply with income. Although higher-income consumers also seek value, they can respond through product choice rather than canceling purchases.
Even modest cost increases can quickly reduce nonessential spending
A small cost increase can push households from keeping up to cutting back. Among households that currently cover essential expenses, 54% say an increase of $249 per month or less would force a reduction in nonessential spending. Nineteen percent say any additional increase would be enough to force a reduction in spending.
One hundred dollars can make a difference. Among households below $25,000 that are keeping up, 59% would cut nonessentials after any increase or a rise under $100. For households between $25,000 and $125,000, the most common threshold is an additional $100–$249 per month. Households above $125,000 generally have more room, although that room is not unlimited.
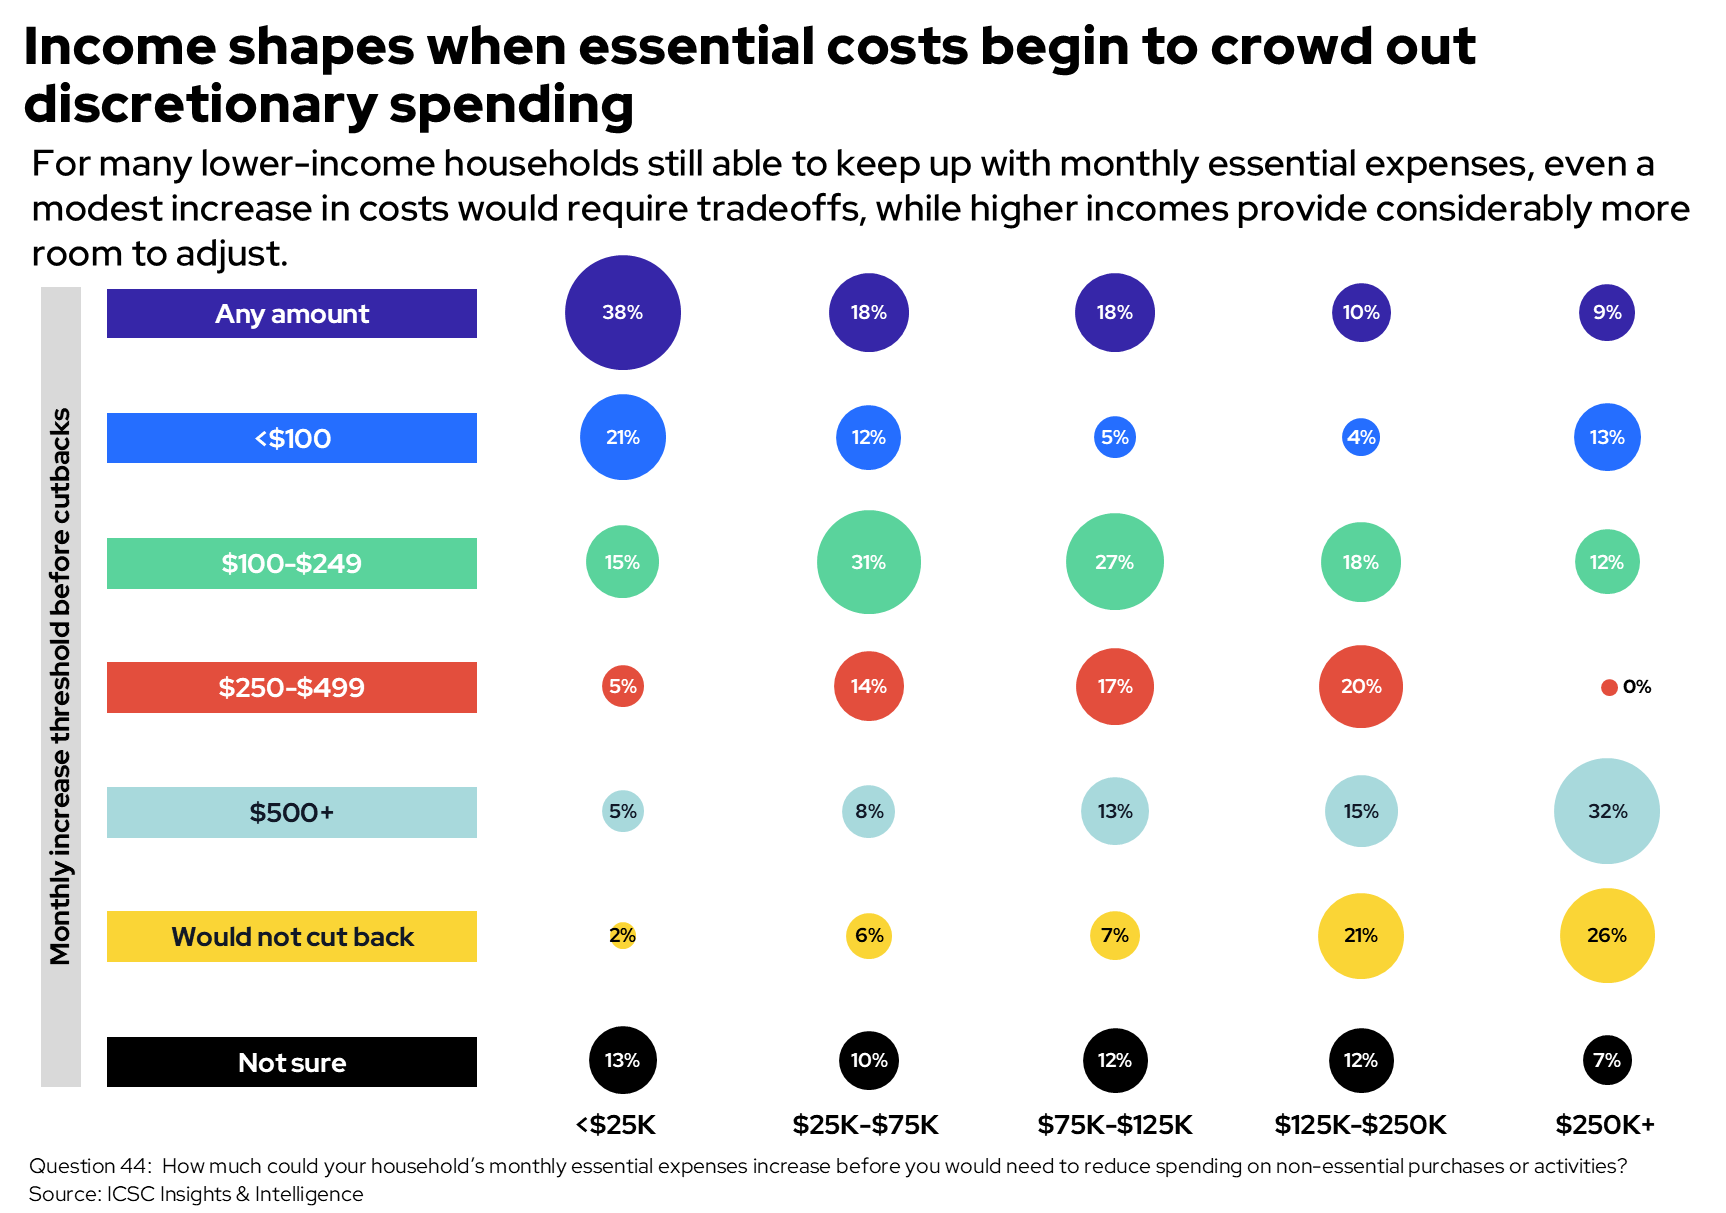
Figure 6. Monthly increase in essential expenses that would trigger nonessential cutbacks, by household income.
These thresholds help explain why nonessential spending can weaken before missed essential payments or widespread delinquency appear. A relatively modest increase in rent, utilities, insurance, transportation or groceries may first lead to fewer restaurant visits, deferred apparel, less entertainment or a delayed household purchase.
Many consumers do not expect near-term relief. Half of all consumers, and 59% of those already unable to keep up, do not expect an expense or debt payment to end or decline enough to improve their finances in the next three months. Pressure may therefore persist without a single dramatic shock.
Labor conditions shape consumers’ financial outlook
The survey's labor findings add context. Overall, 35% of employed adults plan to look for another job over the next three months. Even among the 84% who feel secure in their current job, about three in 10 plan to search. By comparison, about two-thirds of workers who feel insecure expect to look for a new job. Gen Z and Millennial workers are most likely to plan a job search. Secure workers who are still searching tend to prioritize better pay and working conditions; insecure workers pair pay with layoff concerns. The rise in layoff concerns as a search reason, from 10% in spring to 22% in summer, suggests that workers may search for both opportunity and protection. [2, 3]
Separate labor-market data provide context for the survey findings. In the second quarter of 2026, unemployment among recent college graduates remained elevated at about 5.6%, while the underemployment rate edged up to 42.0%, indicating a difficult early-career job market. Pay is another reason to search. In July, the Atlanta Fed’s Wage Growth Tracker was 4.4% for workers who changed jobs, compared with 3.6% for those who stayed put. Together, these data suggest that some younger workers are seeking a stronger position in the labor market. The wage advantage for job changers also helps explain why better pay is the leading reason survey respondents give for searching. [11, 12]
These conditions support a view of guarded optimism. A majority expect their finances to improve over the next year, including many who currently rate their situation poorly. But optimism does not remove current constraints; it can coexist with more careful spending today as households work toward improvement.
Why this matters
Spending totals can overstate financial strength. The summer findings show that households can report higher spending while trading down, delaying purchases and cutting discretionary categories. Sales growth in dollars may therefore reflect higher prices and essential costs rather than broader demand. Sales figures provide a clearer picture when considered alongside category mix, units, promotions and payment behavior.
Consumers are still spending, but purchases require a stronger reason. Most consumers, including those expecting to reduce nonessentials, can still identify a reason to buy. The key question is what earns priority. Price, usefulness, planning, occasion, convenience and quality can each support a purchase, but no single factor works for every group or category.
Financial stability reveals more than whether spending rises or falls. Savings, confidence and room after bills separate consumers who can choose carefully from those who must delay purchases. Current bill payment can hide financial strain when households maintain it by saving less, drawing down savings or taking on debt.
Aggregate improvement can coexist with category pressure. The overall nonessential outlook improved from winter, while dining, travel and luxury weakened after spring. Together, these results suggest consumers are reallocating discretionary spending rather than increasing every category. Category and tenant mix will determine which businesses feel the effects even when overall consumer spending remains active.
The findings offer an early view of where pressure is building. The survey captures self-reported behavior and intentions at one point in time. It does not predict actual sales. It shows where purchasing decisions are becoming more constrained before those changes fully appear in overall spending. Businesses can compare these findings with observed units, basket sizes, traffic, switching, loyalty and credit behavior as the year progresses.
Methodology
ICSC surveyed 1,003 U.S. adults age 18 and older online from July 29–31, 2026 as part of Big Village’s CARAVAN omnibus survey. Results were weighted using the supplied standard survey weight. Sample sizes vary by question because of survey routing. Percentages for multi-select questions are independent and may exceed 100%. Other percentages may not total 100% because of rounding.
The findings were collected at one point in time and are self-reported. They include assessments of current finances, reported recent spending behavior and stated intentions for the next three months. They do not establish cause and effect or measure observed sales, actual switching, traffic, basket size or future outcomes. Results for small subgroups—especially the $250,000+ income segment—are as general indicators rather than precise estimates.
This report supplements the ICSC survey with separately sourced, current economic data. Those data describe overall economic conditions and use populations, measures and time periods that differ from the survey. They provide context only; they do not validate individual survey responses or show that the survey caused or predicted the reported economic results.
Sources
[1] ICSC Insights & Intelligence. Consumer Spending Behaviors. Fielded April 1–3, 2026; n=1,000.
[2] ICSC Insights & Intelligence. Consumer Spending Pulse—Q2 2026. Fielded May 1–3, 2026; n=1,009.
[3] ICSC Insights & Intelligence. Consumer Spending Monitor—July 2026. Fielded July 29–31, 2026; n=1,003.
[4] U.S. Bureau of Economic Analysis. Personal Income and Outlays, June 2026. Released July 30, 2026. Official release.
[5] U.S. Census Bureau. Advance Monthly Sales for Retail and Food Services, June 2026. Released July 16, 2026. Official release.
[6] University of Michigan Surveys of Consumers. Final Results for July 2026. Interviews conducted June 23–July 27, 2026. Official release.
[7] U.S. Bureau of Labor Statistics. Consumer Price Index, July 2026. Released August 12, 2026. Official release.
[8] ICSC Insights & Intelligence. Consumer Spending Monitor—Q1 2026. Fielded February 20–22, 2026; n=1,007.
[9] Federal Reserve Bank of New York. Quarterly Report on Household Debt and Credit, 2026 Q2. Released August 4, 2026. Official report.
[10] Board of Governors of the Federal Reserve System. Consumer Credit (G.19), June and Q2 2026. Released August 7, 2026. Official release.
[11] Federal Reserve Bank of New York. The Labor Market for Recent College Graduates, 2026 Q2. Updated August 6, 2026. Interactive data.
[12] Federal Reserve Bank of Atlanta. Wage Growth Tracker, July 2026. Updated August 13, 2026. Official data.