ICSC Insights & Intelligence
Survey conducted May 13-15, 2026
Convenience is best expressed in an omnichannel environment, where consumers can choose how to purchase, receive and return products. The concept is most powerful when those choices work together to reduce cost, time, effort and uncertainty across the journey.
Executive Summary
- Convenience reflects a bundle of tradeoffs, not a single attribute. Shoppers evaluate multiple dimensions: total price at checkout, arrival time, fit and fulfillment uncertainty, return effort and store access. Ninety percent of consumers would accept slower shipping to save money, but tolerance has limits: the median maximum wait for standard free delivery is five days, and 80% set a maximum of seven days or fewer.
- The mass-market premium for speed is modest. Forty percent would pay nothing for faster delivery, while another 34% would pay up to $3 more. The distribution supports a dependable, free standard option paired with clearly priced, faster delivery options rather than making speed the default for everyone.
- Stores can lower several shopper costs at once. Even for those consumers who shop online, the store possesses tremendous value for its immediate product access, product inspection options, avoidance of shipping fees and wait times, product discovery and easier returns. That makes a physical store both an alternative to home delivery and part of the online relationship, supporting pickup, product inspection, service and returns.
- Friction can change where, when and whether a purchase occurs. Seventy percent of consumers who shop online frequently or occasionally abandon carts over shipping costs and 54% do so because of timing. Most respondents say they would shift channels or retailers, or purchase later, rather than give up entirely. Cart abandonment is a demand-routing problem as well as a conversion problem.
Eight signals that define the choice
Shoppers still value convenience, but they price its components differently. They may wait to save, choose a retailer because shipping is free, resist a return fee and rely on a store when physical access lowers the cost of completing or returning a purchase.
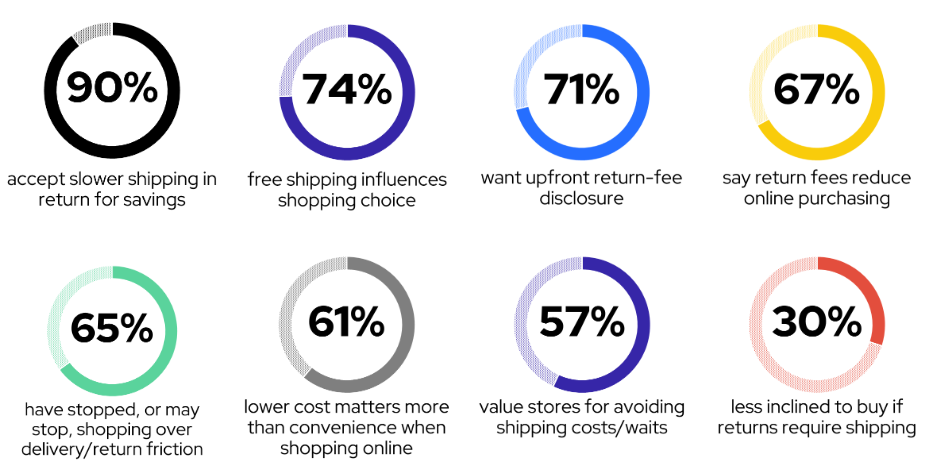
Source: ICSC Cost of Convenience Survey, May 13–15, 2026.
Free delivery has a time budget; speed has a modest price corridor
A willingness to wait is not an unlimited tolerance for delay. Ninety percent of adults would accept slower shipping for savings. The longest acceptable wait for standard free delivery averages 6.3 days, with a five-day median. Fifty-six percent set a maximum of five days or fewer and 80% seven days or fewer.
Forty percent would pay nothing for faster delivery, 34% would pay up to $3 more, 16% would pay $4 to $5 more, 7% would pay $6 to $10 more and 3% would pay more than $10. In unrounded results, 27% would pay at least $4 more. These stated thresholds are not a demand curve, but they are more useful than assuming speed is uniformly valuable.
The implication is a range of delivery choices. A reliable free option can exchange time for savings, while faster options serve time-sensitive occasions. Showing the arrival date and fee together makes the tradeoff clear. Reliability matters at every speed: a premium has little value if it does not buy a meaningful improvement.
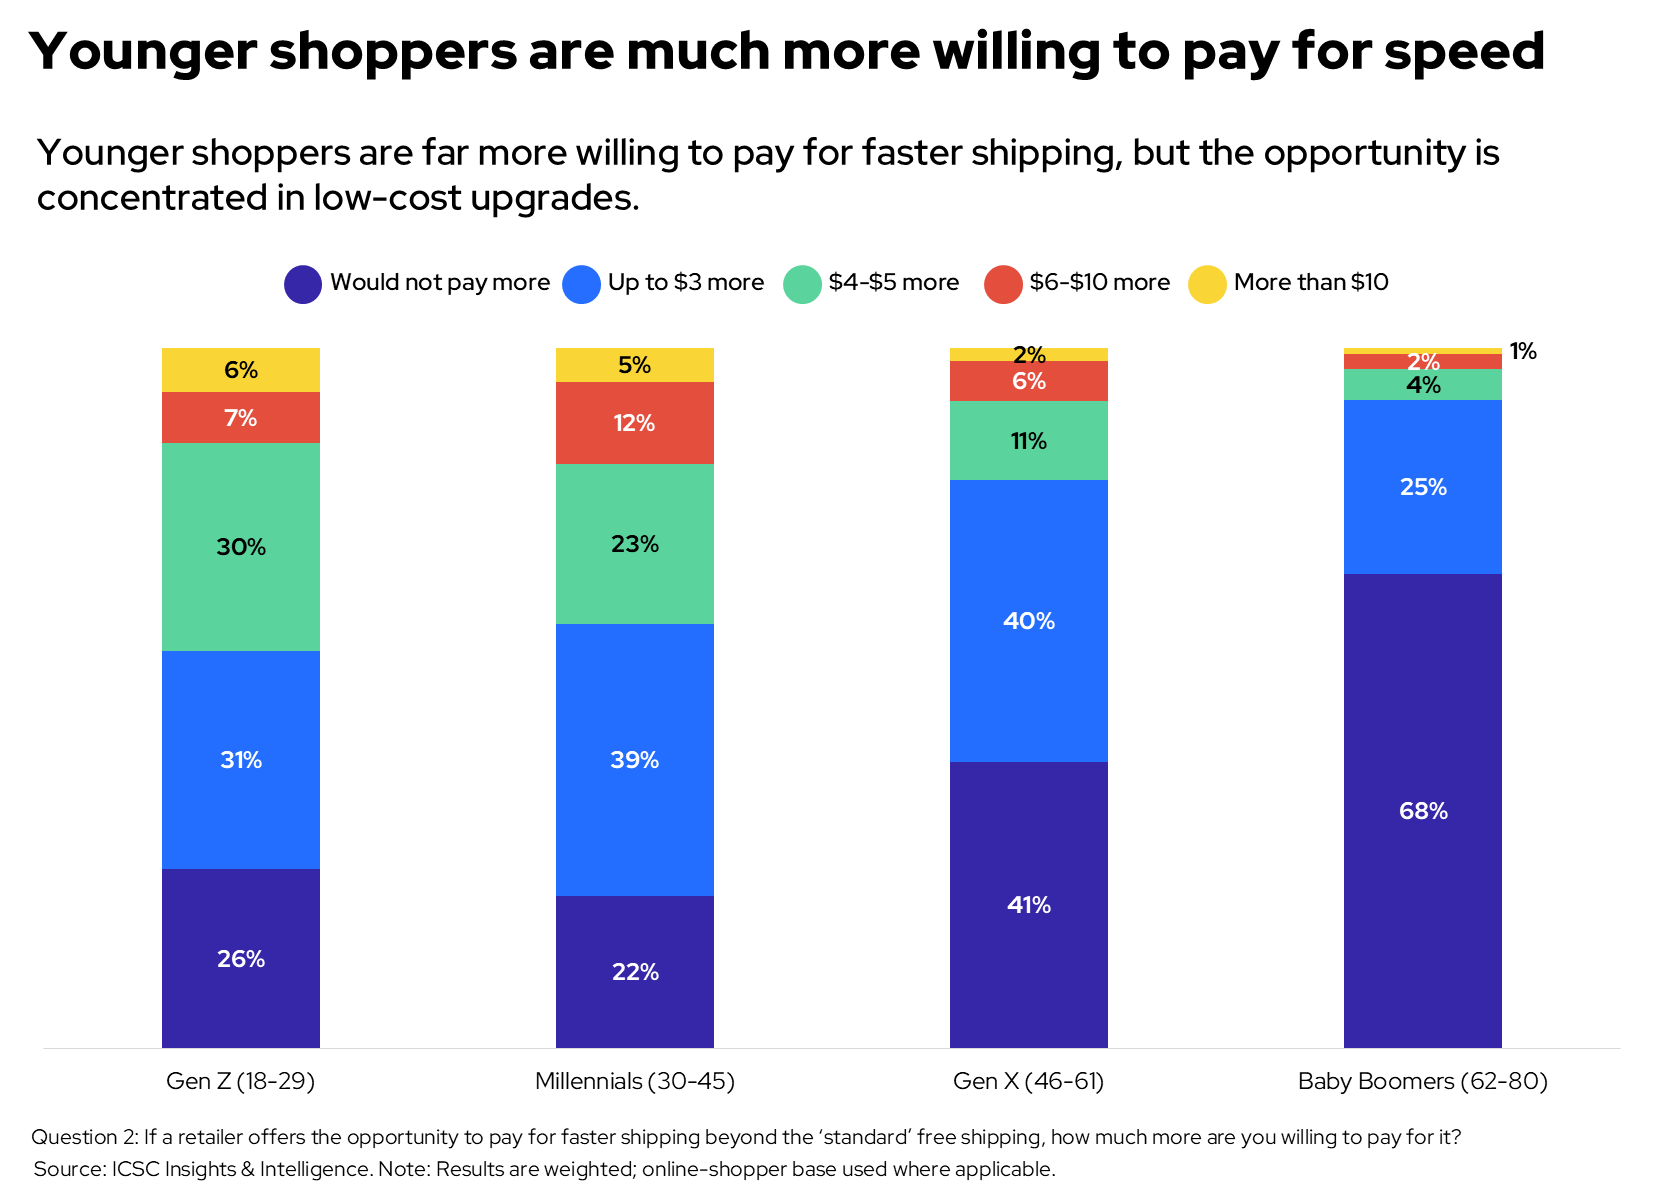
Figure 1: Willingness to pay for faster delivery by generation.
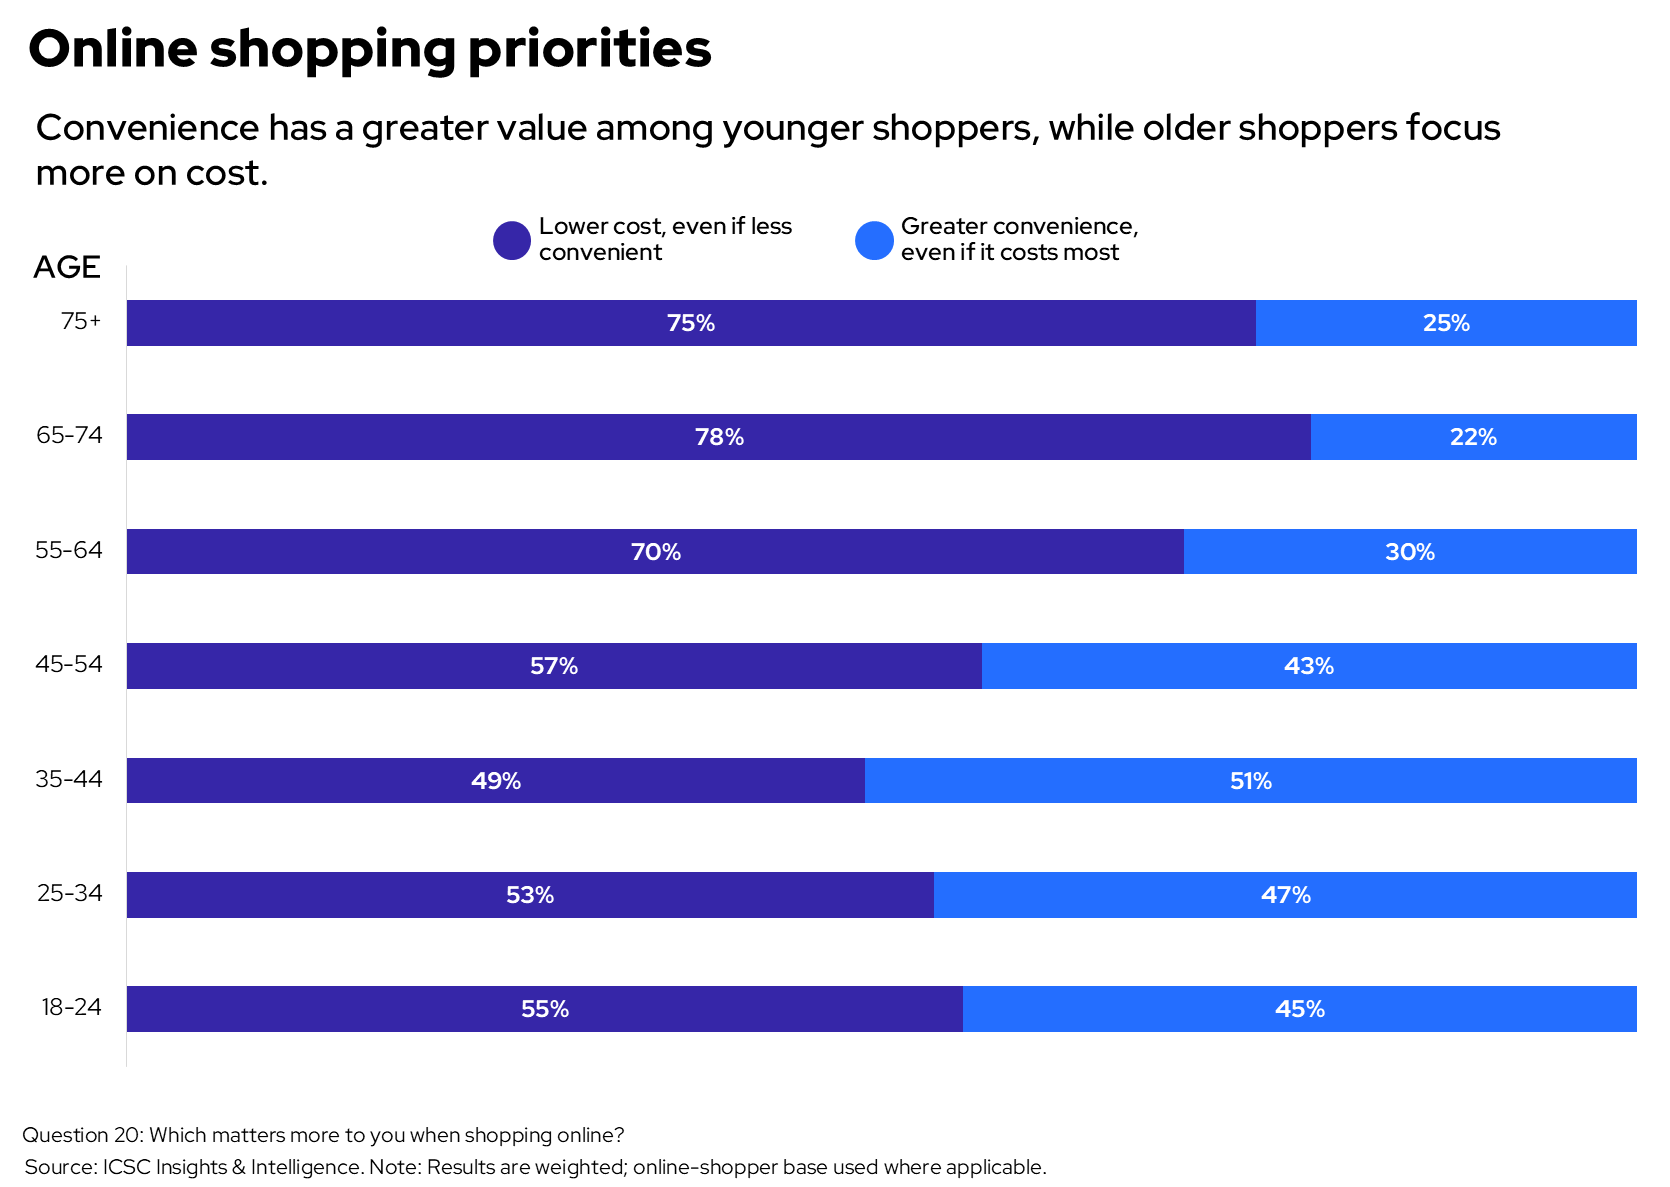
Figure 2: Lower cost versus convenience by age.
Cart friction often redirects demand instead of eliminating it
Cart abandonment can change the allocation and timing of demand without ending the shopping occasion. Seventy percent of consumers who shop online say they frequently or occasionally abandon carts because of shipping costs; 54% say the same about delivery timing. The destination of that demand is commercially decisive.
Among shipping-cost abandoners, 37% say a retailer’s store is their most likely next action, 37% order from another retailer, 16% wait and buy from the same retailer at a later time and 9% give up entirely. Among timing abandoners, 40% point to a retailer’s store, 37% to another retailer, 18% to the same retailer later at a later time and 5% give up altogether. These stated actions—not observed transactions—show whether demand is delayed, redirected to another channel or retailer, or lost entirely.
Roughly four in five consumers who shop online (82%) noticed at least one change in retailers’ shipping or return practices during the past year. Among those consumers, 41% said the changes led them to buy in a store instead, 31% to buy less overall, 30% to buy from a different retailer and 28% to combine purchases into fewer orders. Respondents could select more than one action, so these percentages overlap.
The same abandonment rate can carry different economics. Making a purchase later is a sign of delayed demand; a same-retailer in-store purchase would be retained demand; a competitor purchase is leakage; and giving up is demand destruction. The survey does not identify the retailer used for the store purchase, so measurement should establish those final destinations rather than treat every abandoned cart as the same loss. The store response also shows why fulfillment friction can affect physical trips.
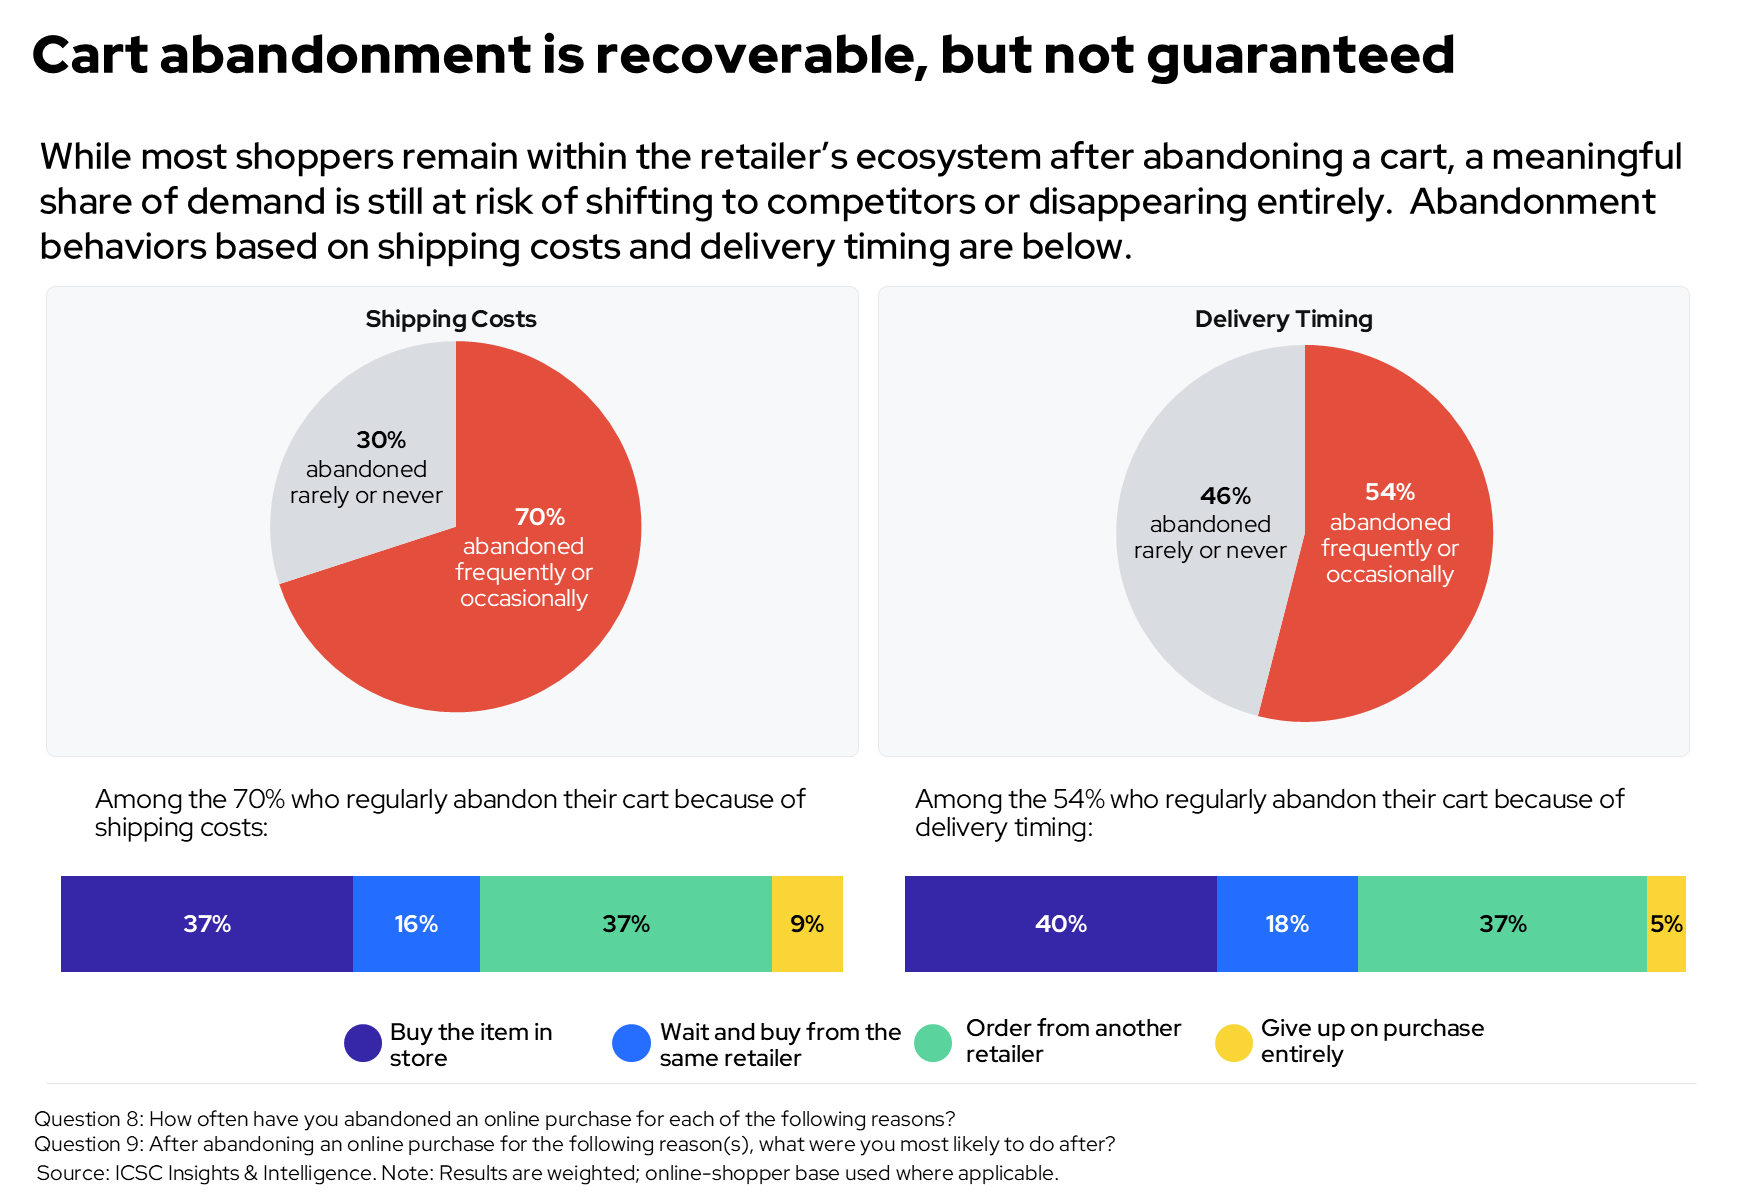
Figure 3: Cart abandonment and most likely next action.
Dissatisfaction does not produce the same response from every shopper—or after every failure. Thirty-seven percent of consumers who shop online say they have stopped shopping with a retailer because of slow delivery, inconvenient returns, or high delivery or return costs. A separate 27% have not stopped but would consider doing so. The first finding describes reported past behavior; the second reflects stated intent.
Asked when added fees or reduced convenience would make them less likely to shop with a retailer, 21% said after one negative experience, while 45% said after multiple negative experiences. Another 25% said only when added costs reach about $10 or more per order, while 9% said these factors do not affect their decision. For many shoppers, friction appears to accumulate, suggesting a potential opportunity for retailers to recover the relationship before dissatisfaction leads to defection. At the same time, a meaningful group reports a one-strike threshold.
Retailers could measure recovery after a missed delivery, unexpected fee or difficult return through later purchases, store visits, service contacts and competitive loss. A local service path may help before failures accumulate. These are self-reported thresholds, not observed churn or a measured recovery effect.
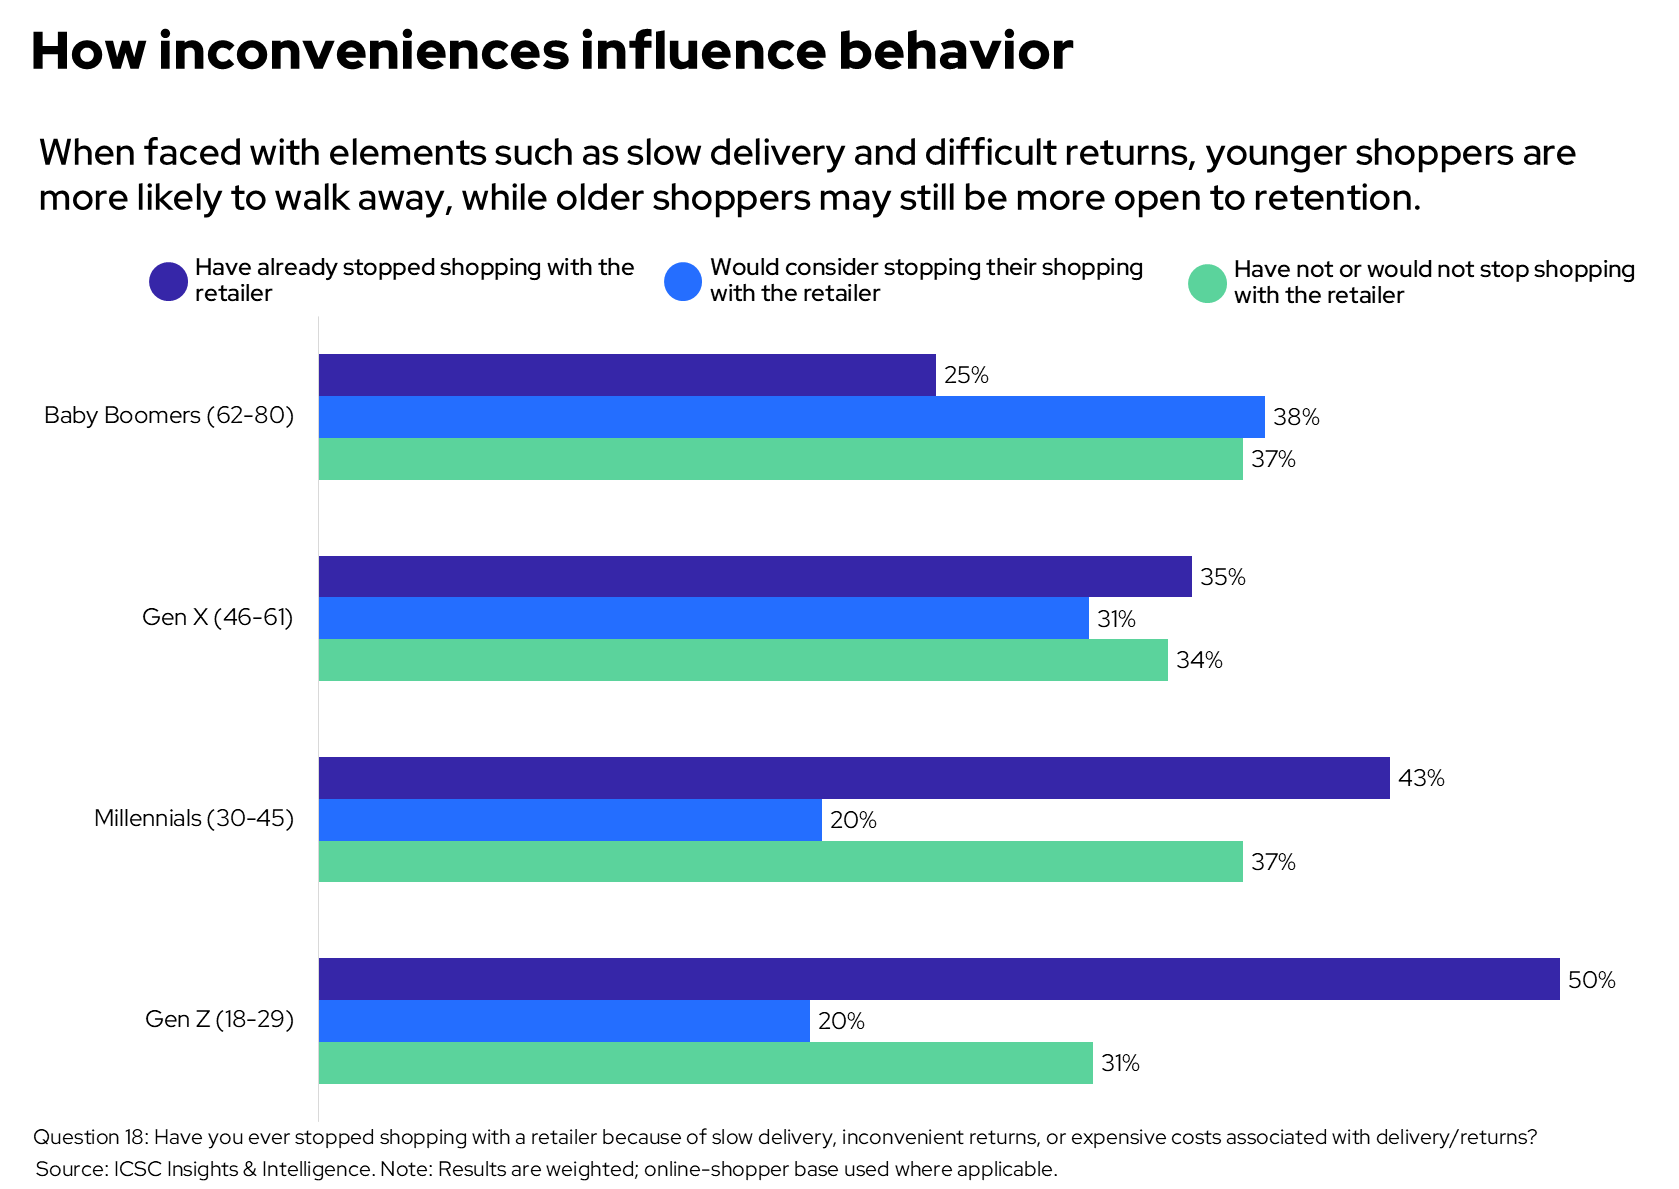
Figure 4: Retailer abandonment over delivery or return friction by generation.
Return policy shapes the sale before a return exists
An easy return functions like insurance against product-fit uncertainty. It gives the shopper the option to return a purchase at a known cost. When that option becomes expensive or inconvenient, its effect can appear before checkout as well as after delivery.
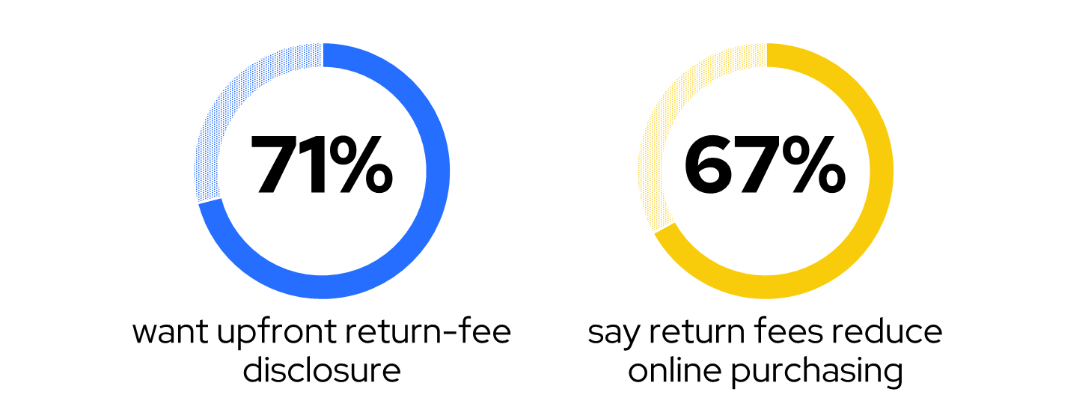
Sixty-seven percent of consumers who shop online say return fees reduce their likelihood of purchasing an item online. Thirty-five percent report $0 as the maximum acceptable return fee. The median maximum is $3 and the mean is $5.50; among respondents willing to pay any return fee, the median is $5 and the mean is $8.40. A fee-tolerant group pulls up the average while the typical threshold remains lower.
A mail-only return changes purchase and post-purchase responses. Thirty percent say it makes them less likely to buy, 31% more likely to keep the item, 29% report no effect and 11% more likely to buy in a store. Separately, 57% very often or sometimes keep an unwanted item because returning it is too difficult or expensive. Return friction can raise the expected purchase cost and create a realized household cost.
Treat return design as part of the offer. Show conditions early, provide a local path where feasible and evaluate customer benefit alongside processing costs. Because the survey does not measure actual return rates or profitability, policy effects require transaction testing.
Upfront disclosure gives shoppers more clarity, but it does not make the fee disappear. Fifty-six percent of consumers who shop online say retailers are not fully transparent about return fees or costs before purchase. Seventy-one percent say they would be more accepting if return fees were disclosed upfront.
Early disclosure is associated with greater stated acceptance. The results do not show that disclosure causes conversion, creates trust or eliminates fee sensitivity. A known fee can be included in the purchase calculation; an unexpected fee adds uncertainty and may force the shopper to reevaluate the order late in the journey.
Product pages, carts and loyalty communications should make fees, thresholds, eligible methods and store alternatives easy to scan and understand. Transaction tests can then determine whether clearer disclosure changes conversion, customer contacts, returns or retention.
Source: ICSC Cost of Convenience Survey, May 13–15, 2026.
Stores convert physical access into omnichannel infrastructure
A physical store can reduce several transaction costs through one local node. Consumers who shop online value stores for immediate access to products (63%), the ability to see and try products (61%), avoiding shipping fees and delivery waits (57%), browsing and discovery (50%), easier returns (44%) and combining errands (42%). These are separate reasons from a multi-select question; the survey does not establish that the same shopper selected every benefit.
Physical store access also creates a fallback path. Among consumers who shop online, 56% say the nearest store for the retailer they shop with most often online is within 30 minutes, 69% within one hour and 26% say that the retailer has no physical store. When asked about the return method, 42% prefer returning in a store, 37% use whichever option is most convenient, 7% typically return by mail and 15% avoid returns when possible.
The store’s role is broader than the register transaction. A store can substitute for home delivery when speed or fees make online fulfillment unattractive and complement an online purchase through pickup, inspection, service and returns. The survey does not estimate property-level returns, but it identifies functions worth assessing: inventory visibility, pickup reliability, return capacity, access and wayfinding.
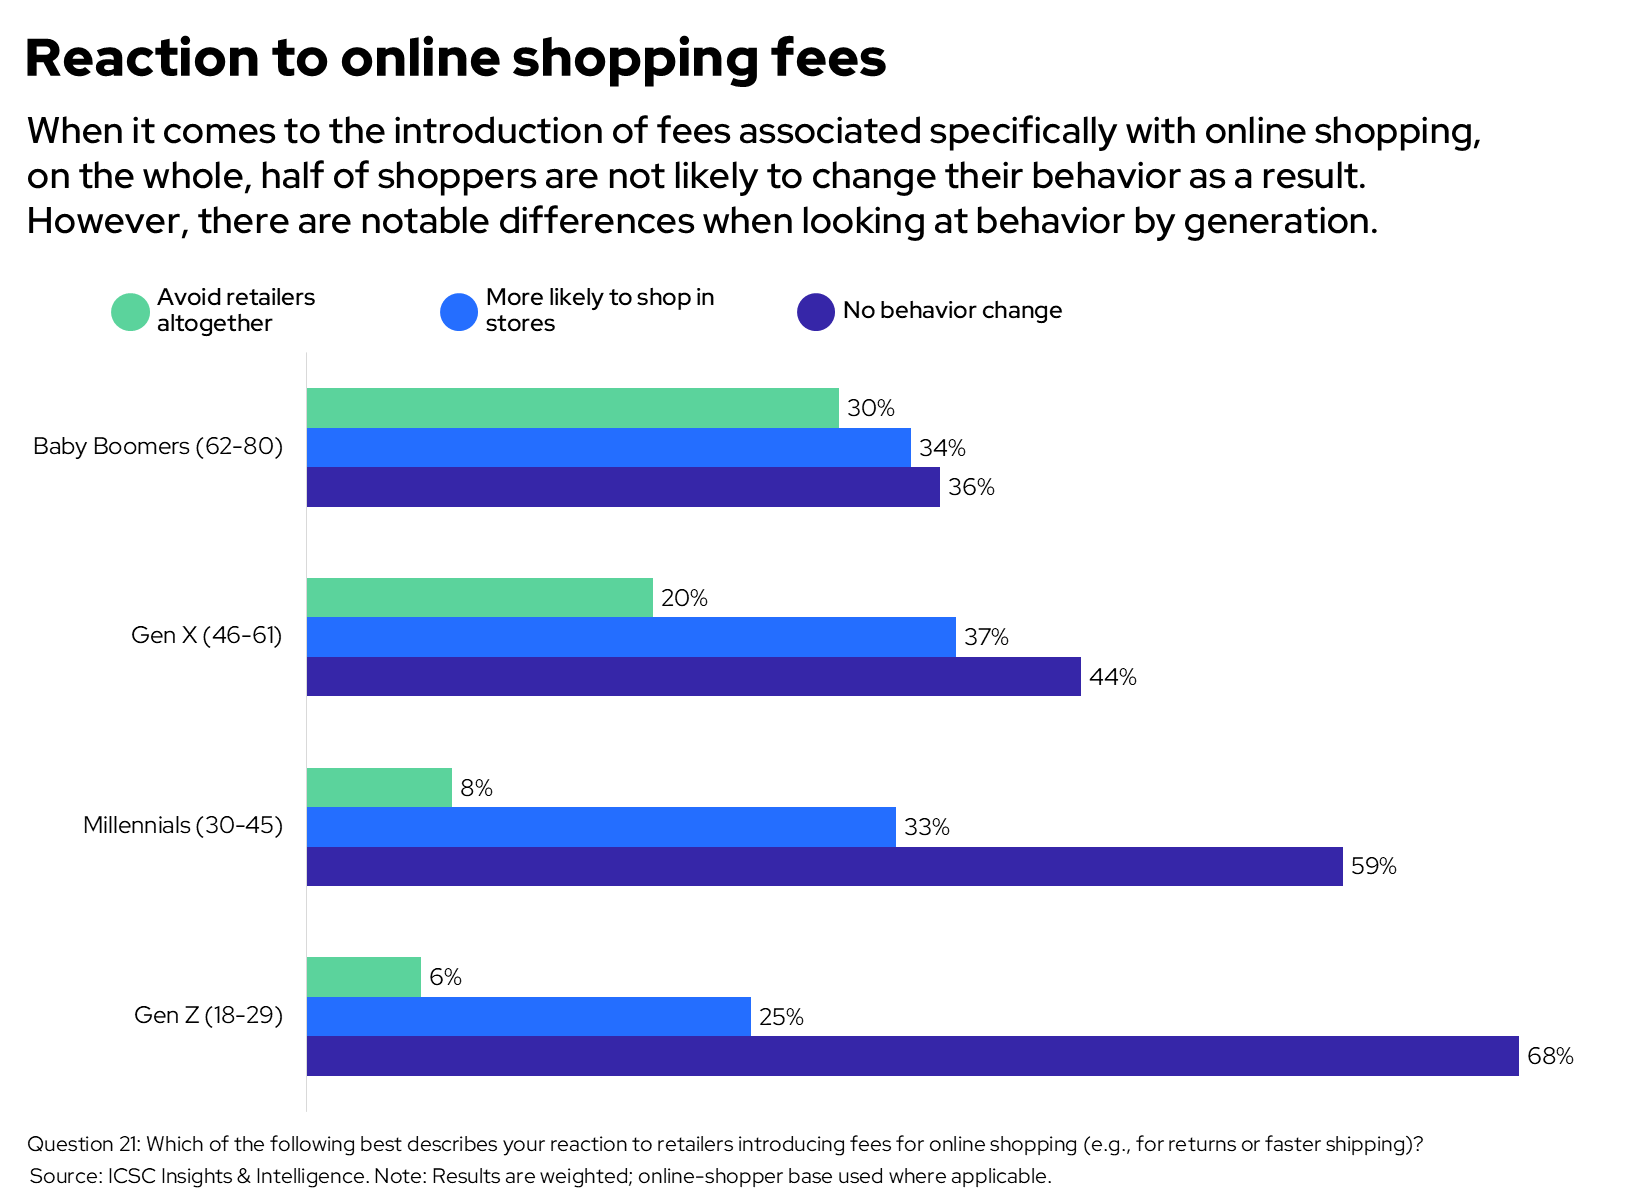
Figure 5: Reaction to retailers introducing online shopping fees, such as return fees or faster-shipping charges, by generation.
Different preferences call for different options—but consistent service standards
Age and income change stated preferences without dividing shoppers into permanent types. In unrounded results, 43% of Gen Z and 39% of Millennials would pay at least $4 more for speed, compared with 7% of Baby Boomers. Older adults more often select lower-cost delivery options and report retailer avoidance when retailers introduce online-shopping fees. These are descriptive group differences, not causal effects.
Income adds a second distinction. Within the $125,000–$249,999 segment, 41% would pay at least $4 for speed. In separate questions among consumers who shop online in that range, 75% say return fees reduce purchase likelihood and 76% have stopped or might stop shopping with a retailer over delivery or return friction. Willingness to pay for speed is not blanket acceptance of other fees. The $250,000+ results are directional because the unweighted base is 23.
Segment the offer while preserving a common standard. Speed tiers, messages and recovery tactics can vary; clear terms, reliable execution and usable return paths should not.
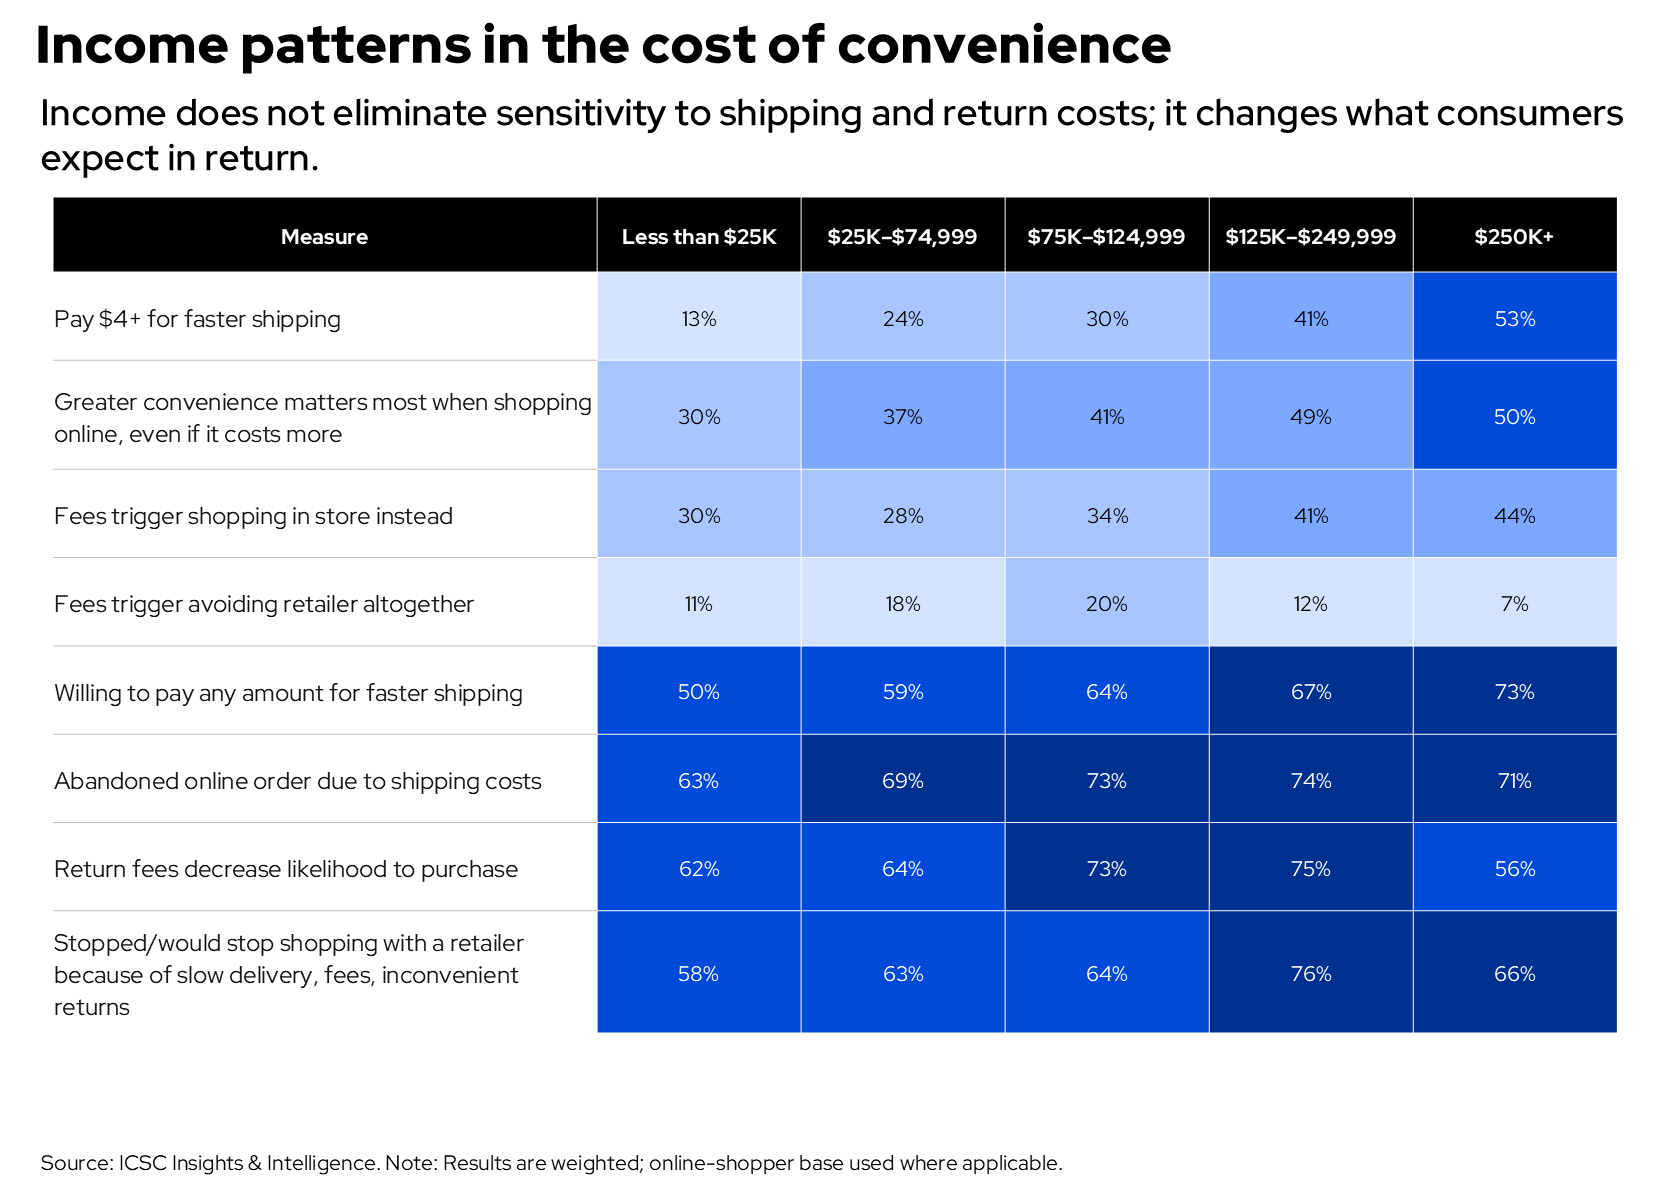
Figure 6: Selected measures by household income.
Why this matters
Owners, developers and retailers all shape the purchase, pickup and return journey because consumers indicated that cost, timing, transparency and access influence not only whether they buy, but where and when a transaction is completed. Stores are part of that journey: shoppers use them to inspect products, avoid shipping fees and waits, pick up purchases, get service and make returns.
Meeting those expectations places a premium on optionality and clarity. A dependable lower-cost delivery option alongside faster paid choices, disclosure of delivery and return costs before checkout and easy-to-understand pickup and return processes make the tradeoffs more visible. Because consumers are price sensitive, friction may redirect demand to another channel or retailer or delay or eliminate the purchase.
For owners and developers, stores can function as omnichannel service points when access, wayfinding and space support pickup and returns. For retailers, consistent service, transparent terms and reliable execution across channels shape where customers complete purchases and whether service recovery retains the relationship.
Methodology and limitations
ICSC surveyed 1,000 U.S. adults from May 13–15, 2026. Results are weighted. Online-shopping questions generally use an unweighted base of 965 and a weighted base of approximately 960; routed questions use their own bases. Unweighted samples govern small-base cautions. Percentages may not total 100% because of rounding, and multi-select measures may exceed 100%.
The findings are a cross-sectional snapshot of self-reported attitudes, stated thresholds, intended actions and reported past behavior. They describe current patterns and associations; they do not estimate causal effects, realized switching, price elasticity, financial returns or change over time.
Source: ICSC Cost of Convenience Survey, May 13–15, 2026.