While the change in migration during COVID was not as dramatic as some expected, even small shifts in migration patterns could have major implications for strategic business decisions. The way Americans move can impact the way retailers reach their audiences, which office space strategies top employers must utilize and how cities and regions drive key tax revenue.
Placer.ai’s latest white paper, Migration Trends Deep Dive, leveraged the company’s new migration analysis tool and dove into the most significant migration patterns and their potential impact on retail and office real estate. Below is a taste.
The full report can be downloaded here.
People are largely rooted
State-level migration data shows that the population change most states experienced between January 2021 and the previous January did not exceed 1 percent. This limited net change shows the ‘stickiness’ of a home area, which is heavily influenced by work, family, schools, the cost of living, and more.
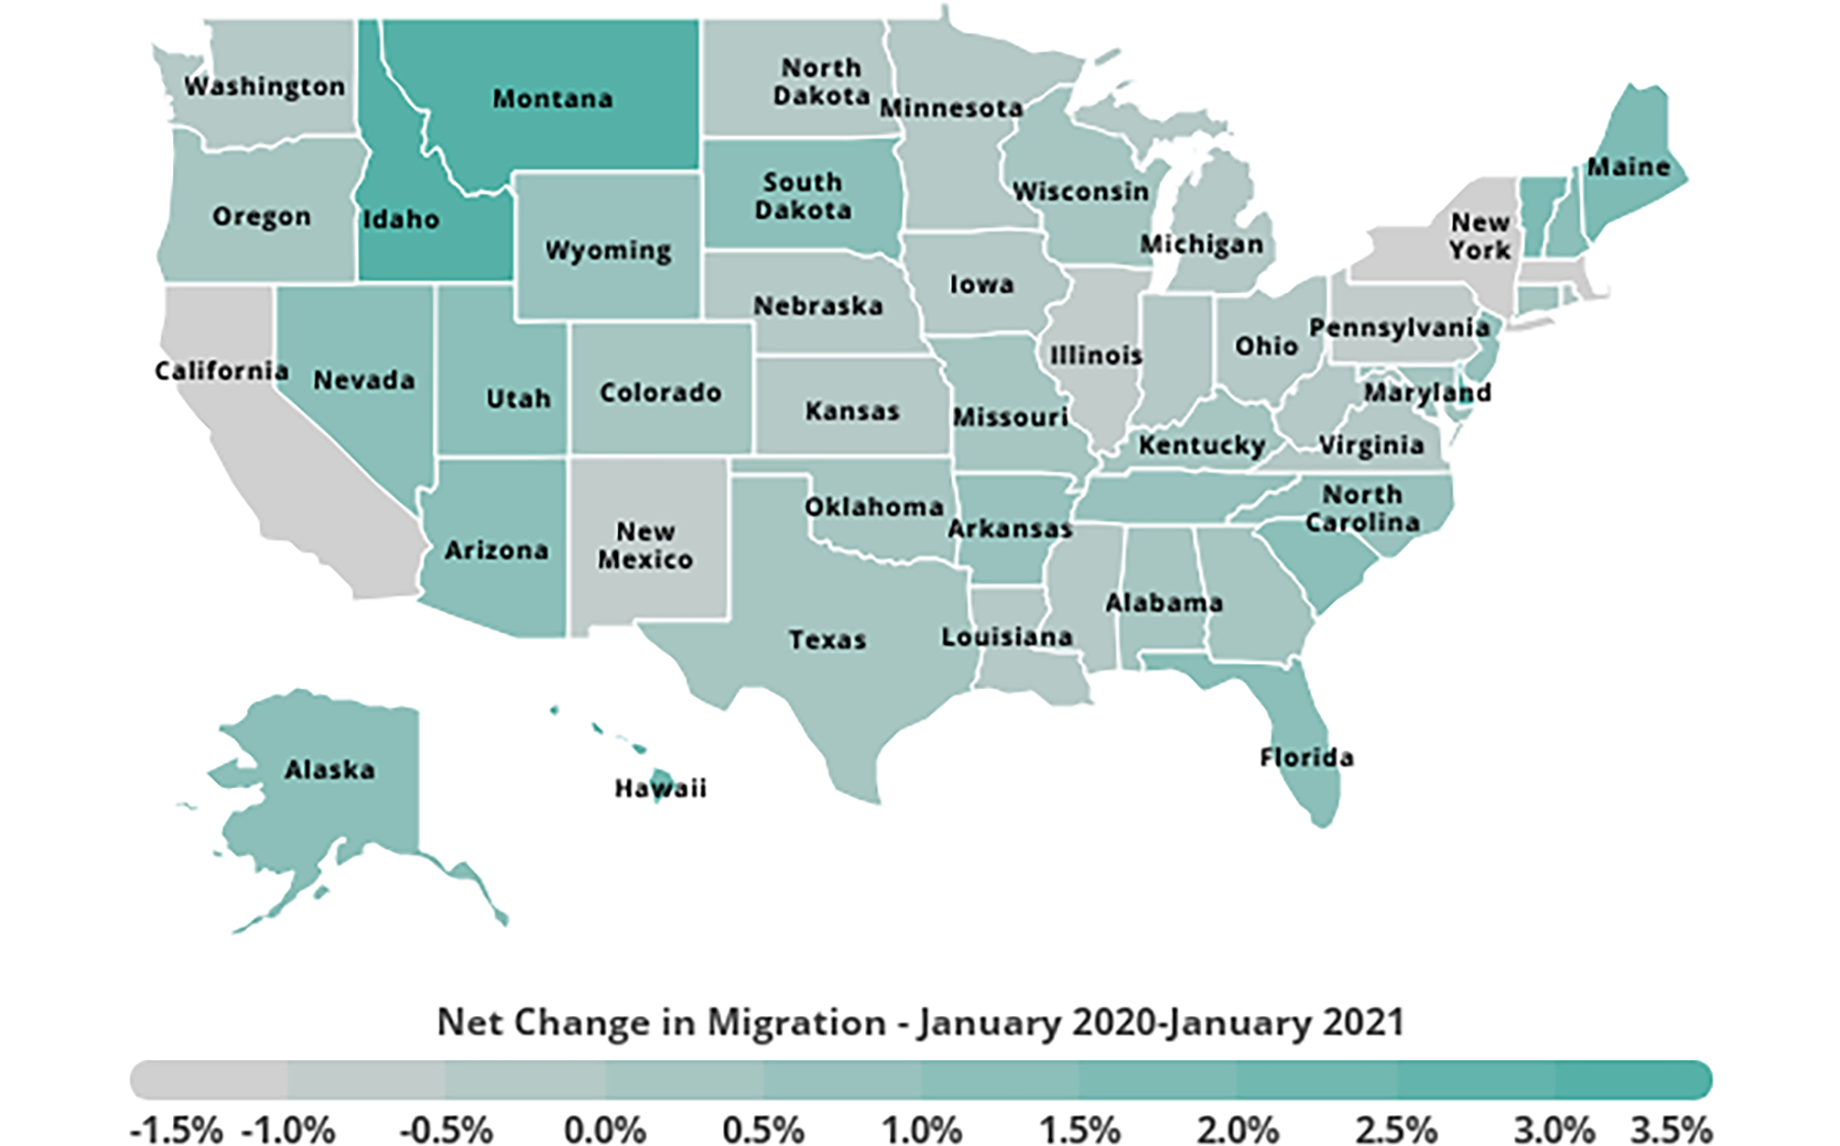
Several states saw exceptional migration rates throughout the pandemic. While low-populated states like Montana and Idaho experienced a year-over-year population growth of 3.7 percent and 3.9 percent, respectively, other states with high-density urban areas like New York, Massachusetts and California experienced negative migration rates of negative-1.8 percent, negative-1.4 percent and negative-1.1 percent, respectively. However, despite these drops, major urban areas can view the overall lack of significant net change as an encouraging sign for a continued future pull of audiences who had been previously priced out of living in these cities.
New regional opportunities
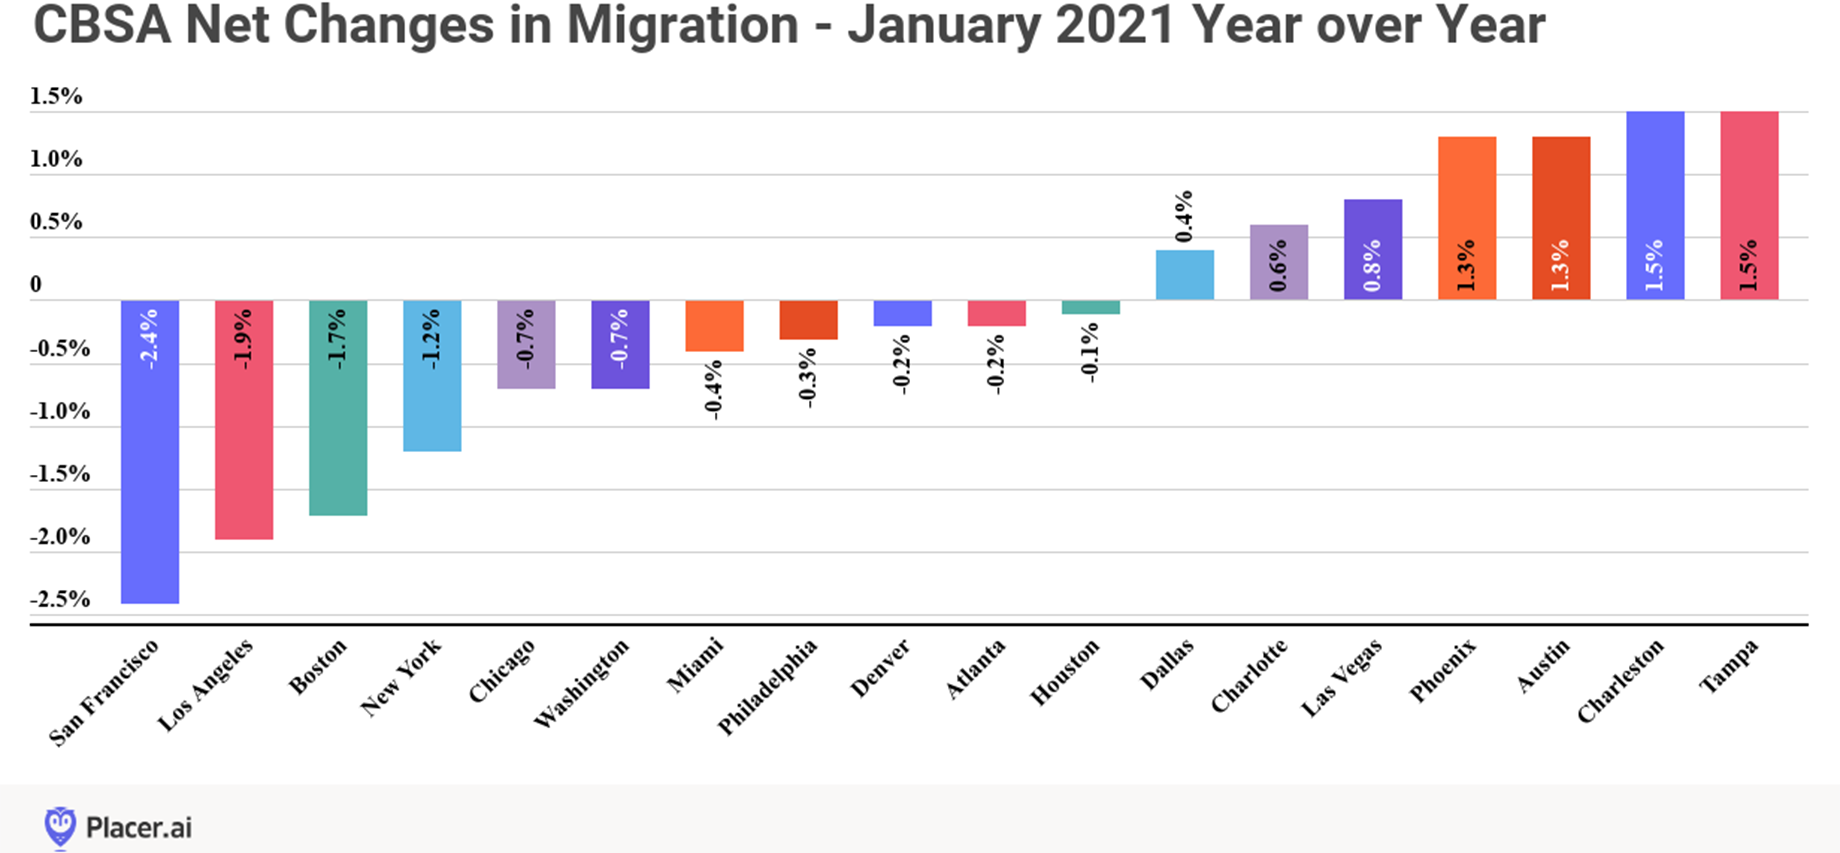
Drilling down to core-based statistical area-level migration data shows a clear distinction in migration trends between northern and southern cities. While southern cities like Phoenix, Austin, Tampa and Charleston drew in many Americans during 2020, major northern and city-oriented metropolitan areas experienced negative migration patterns. San Francisco, Los Angeles, Boston and New York all saw significant dips.
Though these regional changes were small from a net perspective, they presented certain areas with powerful opportunities. Warmer-climate areas that saw net population increases were given an opportunity to boost their retail, office and commercial real estate landscapes. As this trend continues, many employers, retailers and real estate professionals are expected to put a greater focus on these rising areas, as they represent powerful long-term opportunities.
How far are they going?
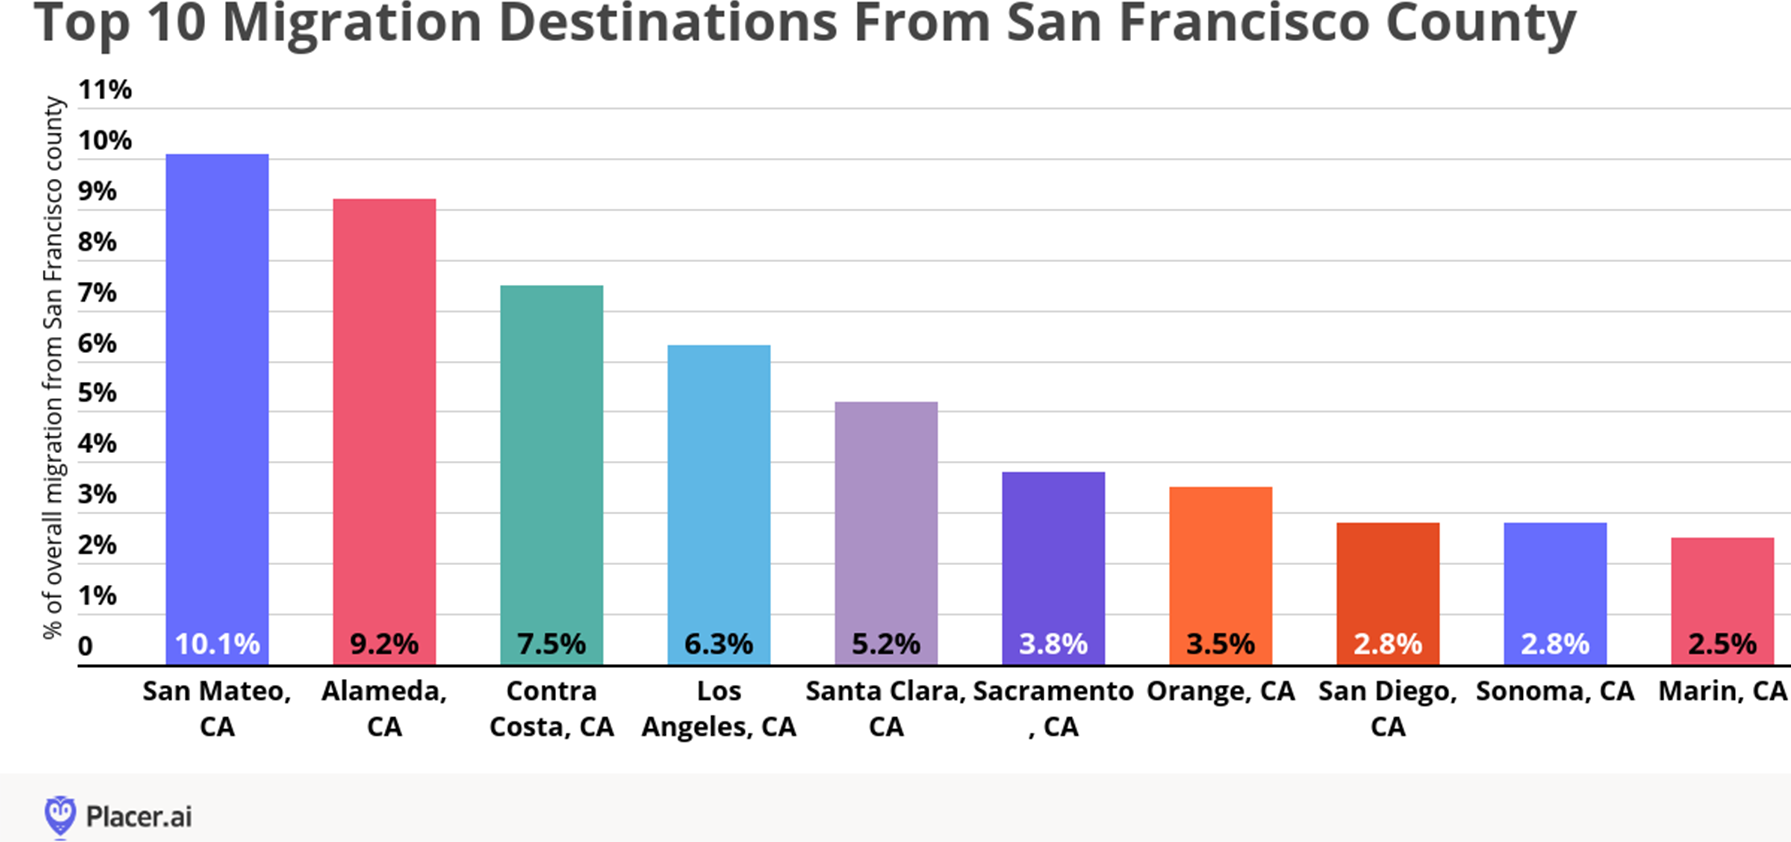
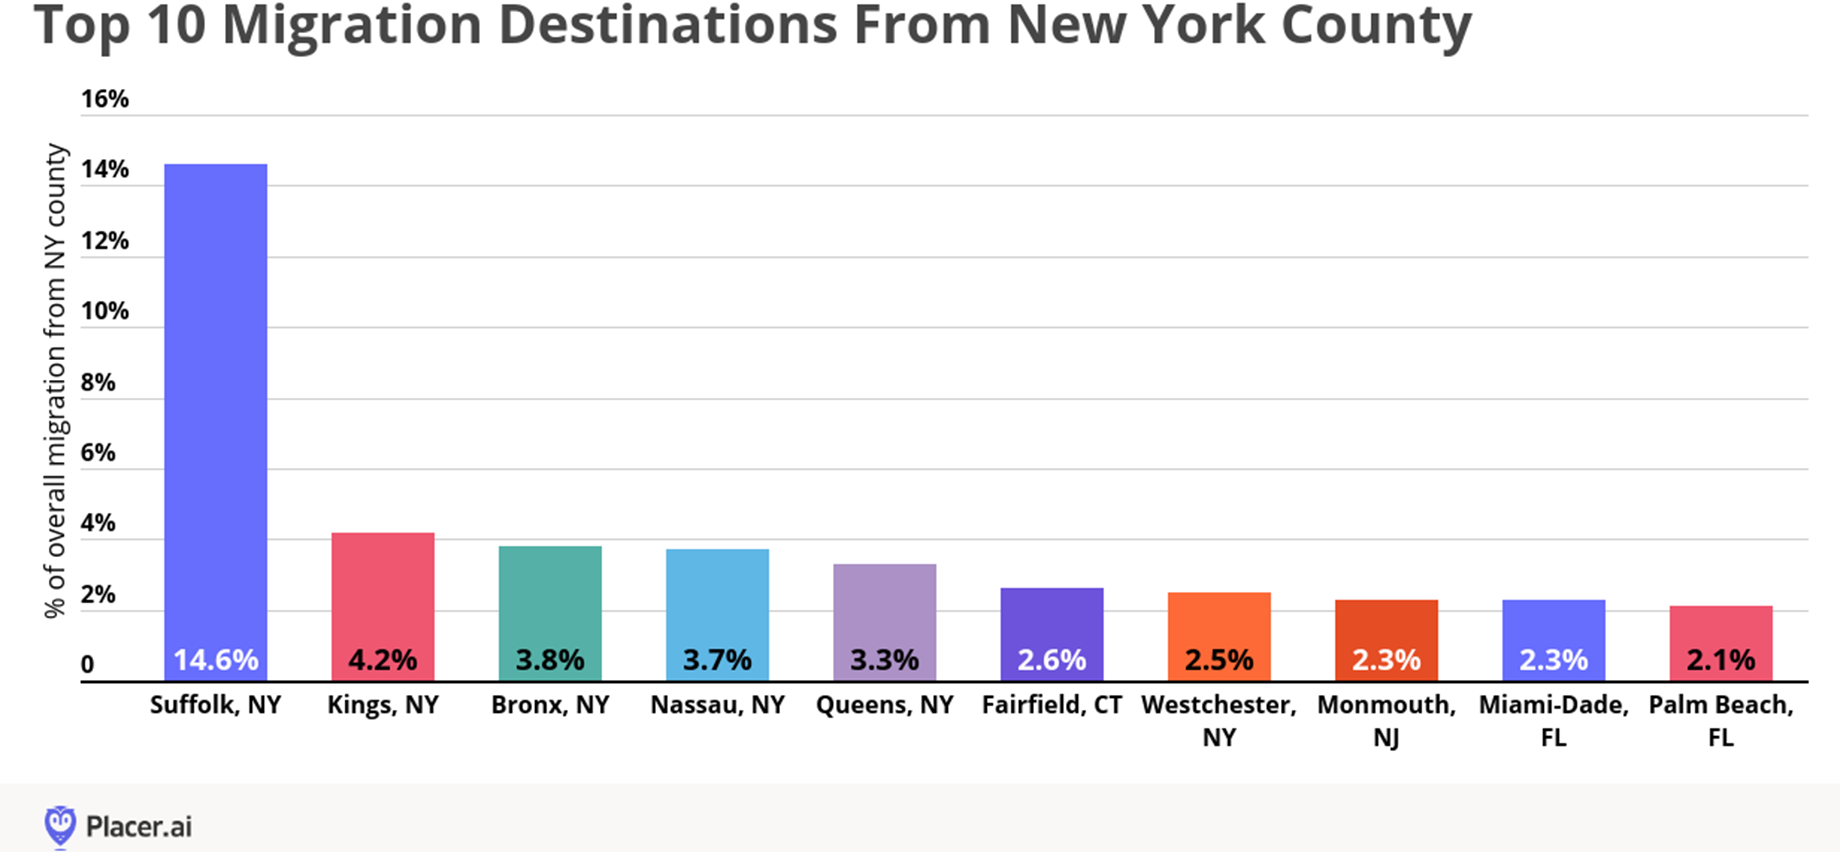
Diving into the county-level migration data of two major cities gave an even clearer picture of local migration patterns. The top 10 counties that San Francisco County residents moved to were all within California, and 16 out of the top 20 were also in-state. In New York County, or Manhattan, the top five migration destinations were also within the state. Of the top 20 destinations, 10 counties were within New York State, four were in adjacent New Jersey and two were in Connecticut.
The clear takeaway is that even large municipalities with high out-of-state migration rates lost a large percentage of their residents to nearby in-state and neighboring out-of-state counties. So while cities may be losing residents in the short term, they aren’t necessarily losing their center of gravity. This information can have a considerable impact on local office and retail distribution decisions.
Check out the full report here.