ICSC Insights & Intelligence
Survey conducted July 6–8, 2026
Executive Summary
Back to school is a stretched, cost-pressured shopping season rather than a single event. Surveyed shoppers report starting earlier while allocating the largest share of expected spending to August. They set budgets, use promotions, combine stores and online channels, and often fold back-to-school shopping into broader trips that include household errands, dining and other retail purchases.
- The season begins early but peaks later. Eighty-four percent say they plan to start earlier than usual, and 54% had already started or completed shopping by the July 6–8 survey period. Yet August carries the largest average share of reported season spending, at 44%. Early activity appears to extend the season rather than simply move it forward.
- Higher planned spending is not necessarily stronger underlying demand. Seventy-nine percent plan to spend more than in 2025. At the same time, 54% are concerned about affording everything they need, and 93% say higher prices have affected or are expected to affect their purchases. Spending can rise even while households' buying power stays limited.
- Stores and online channels perform complementary roles. Ninety-one percent report spending or expecting to spend in physical stores, 85% report spending online and 76% report spending in store and online. Shoppers tend to use both channels together, handling browsing, comparison, purchase and pickup in different places.
- The store trip extends beyond the school list. Among in-store shoppers, 93% expect at least one other activity during the same trip. Shopping for household needs, dining and shopping for non-school items are the most common additional activities. These are activities shoppers expect to combine with the trip, though the survey does not show that the back-to-school visit causes them.
Overall, the season pairs necessity-based purchases with tight household budgets. Shoppers manage that tension by starting early, watching promotions, prioritizing necessary items and moving between channels. Retail destinations can respond by making value easy to evaluate, coordinating store and digital services, and reducing the effort required to complete several household tasks in one trip.
Back-to-School Spending Is Highest When Needs Are More Complex
Younger adults drive participation, but they are not all shopping for the same needs. Half of U.S. adults say they will buy back-to-school items in 2026. Participation reaches 76% among Gen Z and 67% among Millennials. Gen Z stands out in college shopping, where many may be both the shopper and the student, while Millennials have the highest K-12 participation. These different shopping roles lead to different product needs and spending levels.
The overall spending average combines several overlapping shopping roles. Estimated spending among shoppers buying for K-12 or college averages $820 and rises to $944 when teacher-related purchases are included. The largest budgets are concentrated among shoppers covering more than one group. Forty percent are shopping for at least two groups, and they report average spending of $1,601, compared with $509 among those shopping for one.
College-related spending is substantially higher. College shoppers report $917 in college-related spending, compared with $372 among K-12 shoppers. The difference reflects the products being purchased, not simply the size of each shopping audience.
Product needs explain most of the spending gap. K-12 budgets are centered on apparel and school supplies, which account for nearly 60% of average K-12 spending. College budgets include more electronics and furnishings, which account for 55% of the college spend average and nearly three-quarters of the spending difference between the two groups. These higher-cost categories also help explain why 29% of college shoppers expect to spend more than $750, compared with 13% of K-12 shoppers.
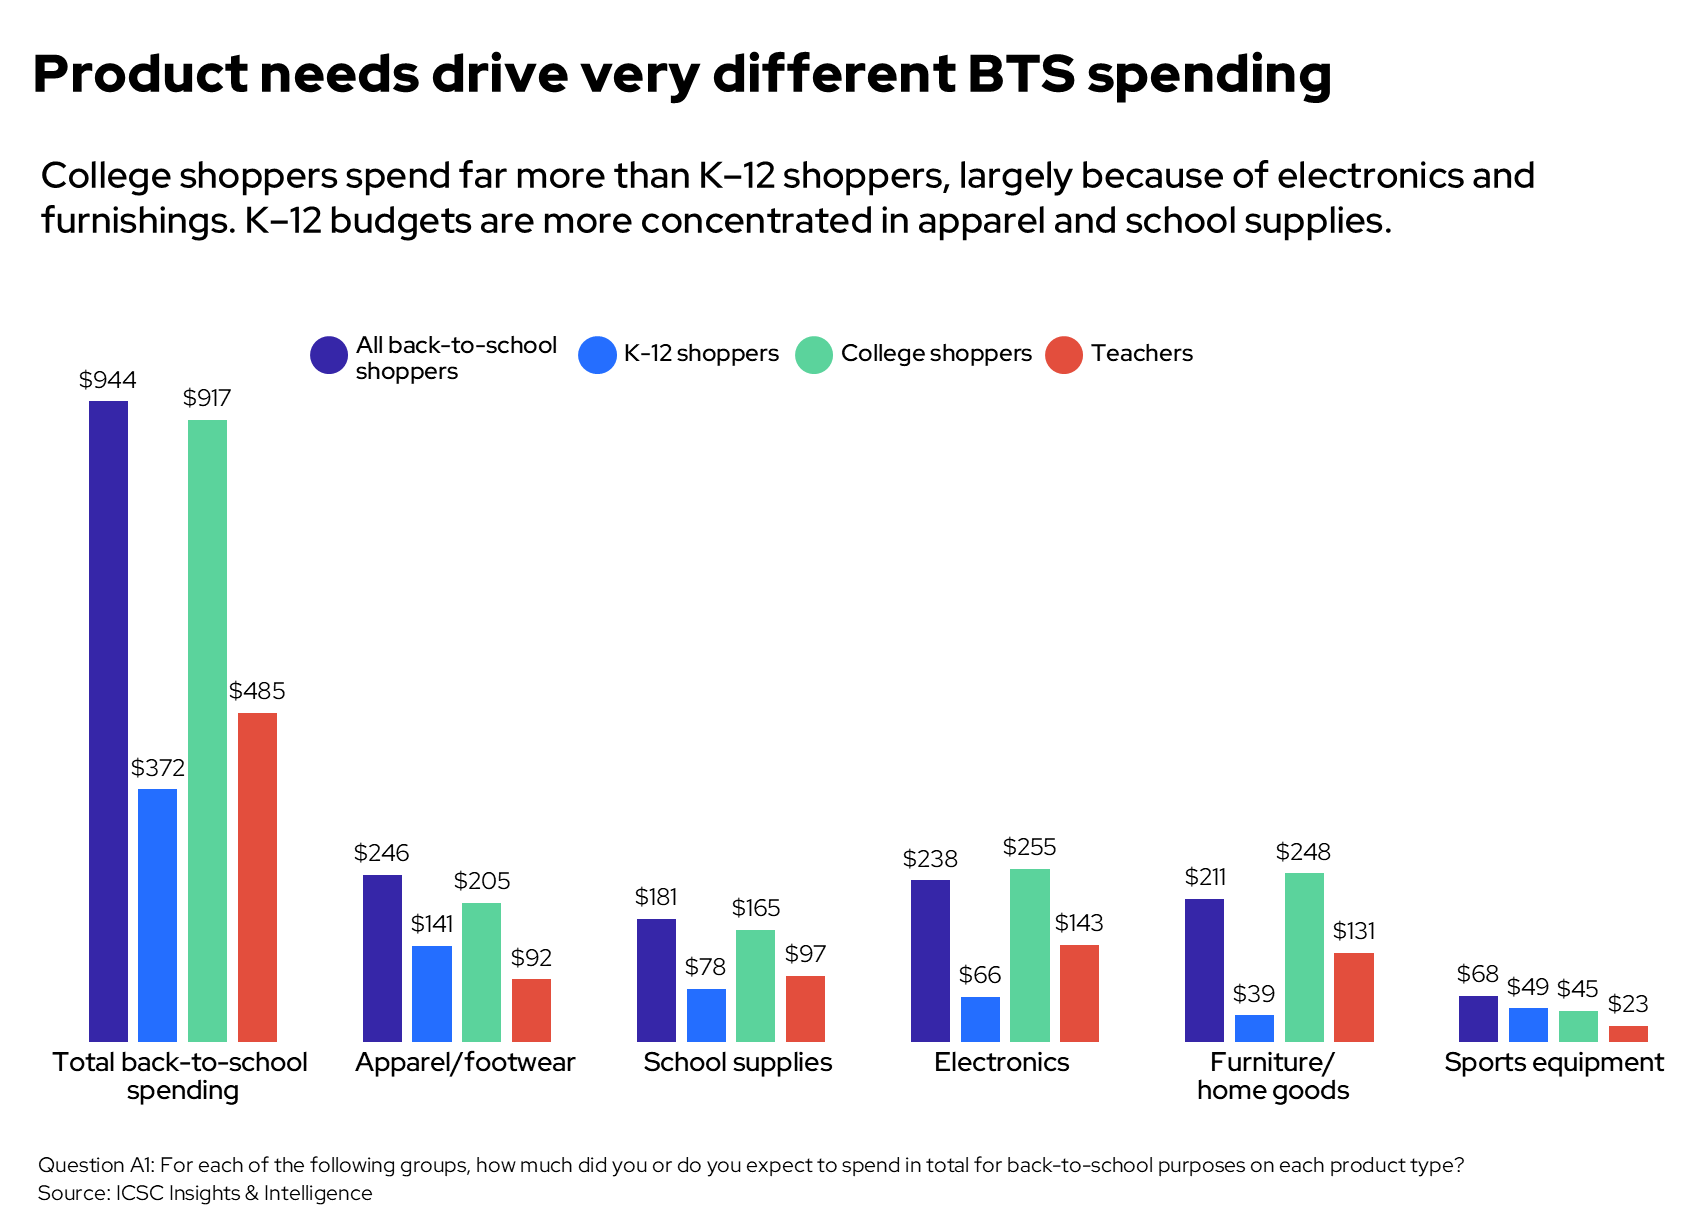
Figure 1: Average expected back-to-school spending by product category and shopper type.
Teacher's purchases add another set of back-to-school needs. Teachers report average spending of $485, with electronics and furnishings accounting for 56% of that amount. Their spending broadens the market beyond clothing and school supplies to include classroom technology, furniture and other items needed to prepare learning spaces.
The Season Is Expanding Across the Calendar
Back-to-school shopping begins well before most reported spending occurs. Eighty-four percent of surveyed back-to-school shoppers say they plan to start earlier than usual, and 54% had started or finished by the first week of July. The first is a stated change from each shopper's usual habit; the second is how far along they were at the time of the survey. Together they indicate an early opening, not that a majority of the season was already complete.
The later peak remains important. Respondents assign an average of 44% of their season spending to August, and 77% report shopping or expecting to shop during that month-placing August at the center of the shopping season. In short, the season runs long, with an early start and a heavier late-summer peak.
The reported reasons for starting early mix convenience, price and risk management. Forty-two percent cite avoiding last-minute crowds, 41% early deals and 34% product availability. Responses overlap, but the pattern is coherent: starting early gives households another way to cope when the list is fixed and the budget is tight.
Promotional events can capture a meaningful portion of early demand. Of the 197 respondents who shopped in June, 57% say they completed all or most of their anticipated shopping during the late-June promotional week. The result does not show that the event created incremental demand; some transactions may have shifted between weeks or retailers. It does show that concentrated promotions can be an important time for early shoppers to finish their buying.
The findings suggest back-to-school works more as a crafted sequence. Early weeks can support browsing, list building and finding deals, while the August peak still calls for inventory, staffing and reliable order fulfillment.
Planned Outlay and Underlying Demand Are Not the Same
The main spending-intention result is striking but easy to misread. Seventy-nine percent say they plan to spend more than in 2025, 16% expect to spend about the same and 4% expect to spend less.
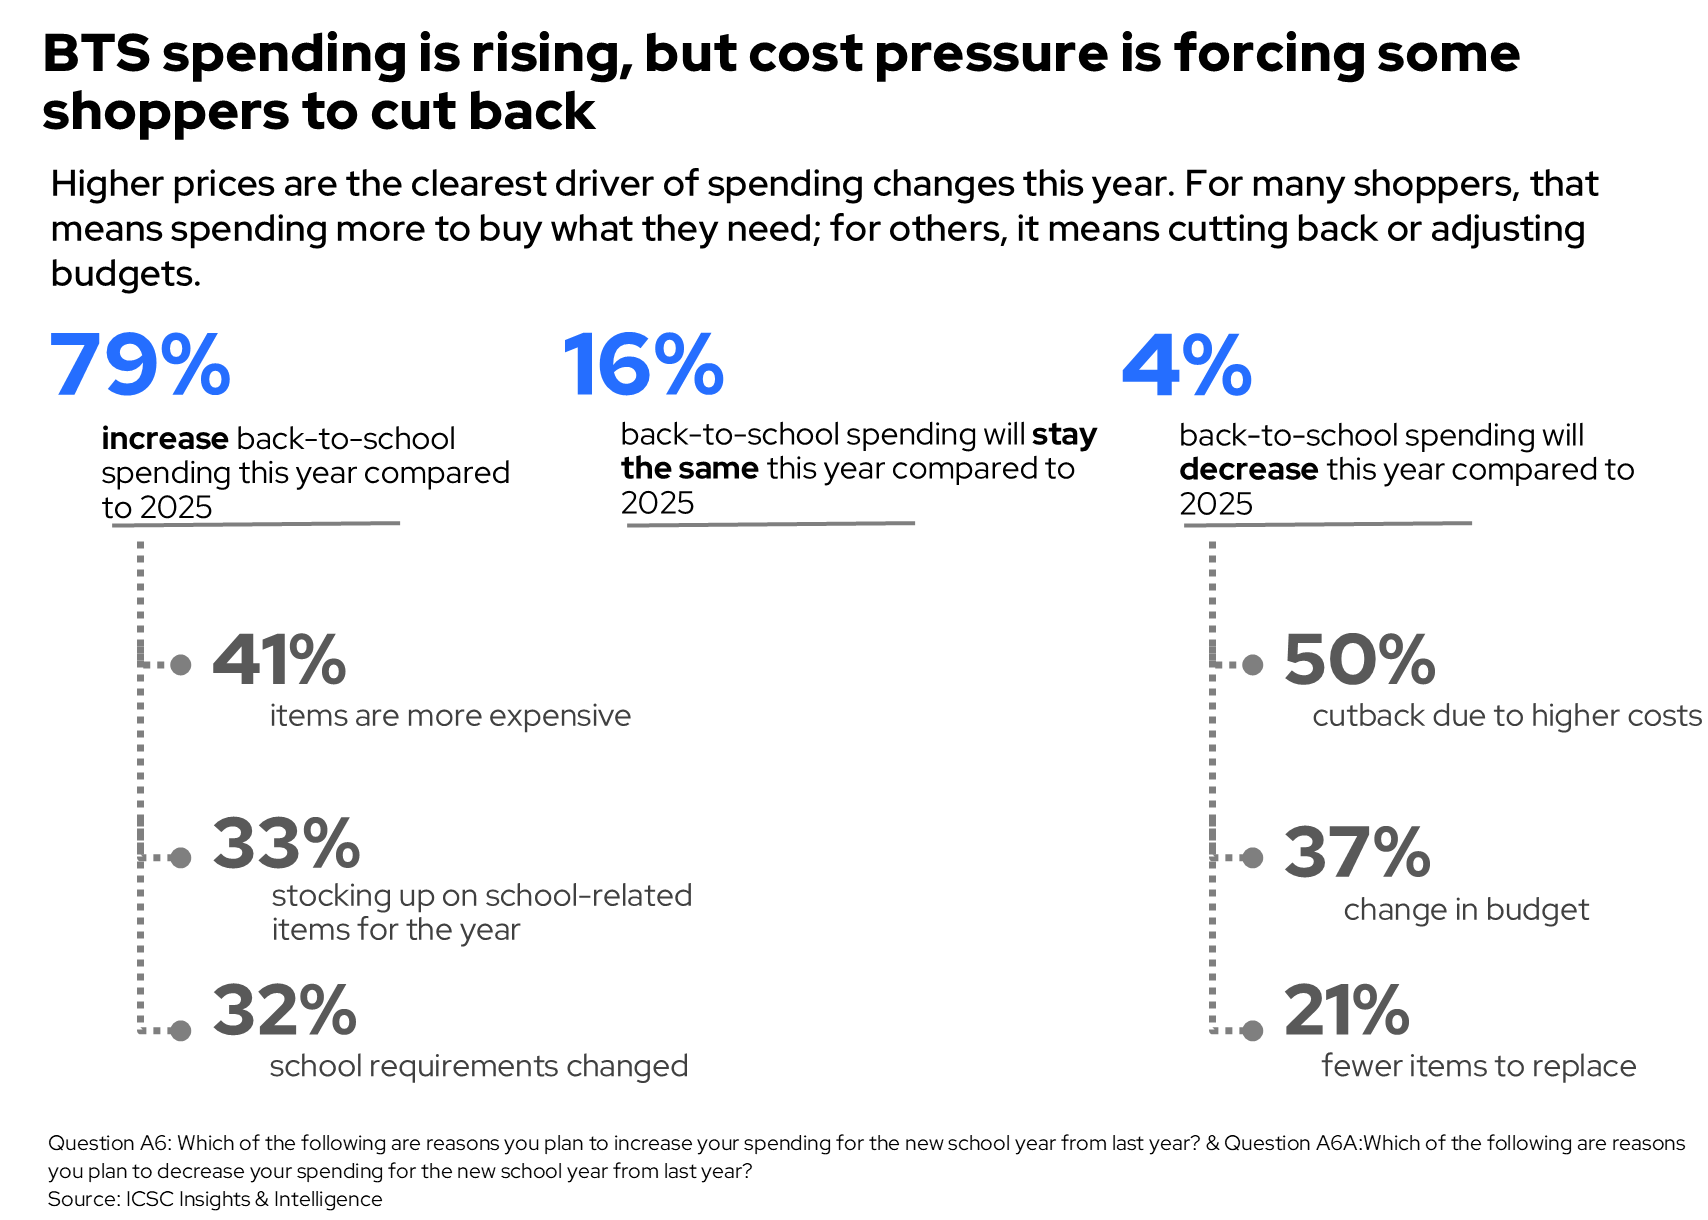
Figure 2: Expected change in back-to-school spending and reported reasons for increasing or decreasing it.
The affordability findings help explain the difference. Fifty-four percent of surveyed back-to-school shoppers are very or somewhat concerned about affording everything they need. So, a higher intended spend can reflect higher prices, a larger or differently timed basket, or changed needs—not simply stronger discretionary demand.
Cost pressure is broad: 93% say higher prices have affected or are expected to affect their purchases. That wording covers both effects already felt and those expected, so it is not a measure of substitution that has already happened. Even so, it points to a nearly universal constraint within the surveyed group. Households can respond to cost pressures by making deliberate choices regarding brand, retailers, timing, quantity, product choice and spending outside the school list.
This distinction matters when judging performance, as revenue can increase because of an increase in unit prices. A larger nominal basket may conceal movement toward lower-priced retailers or brands, a reduction in optional purchases and greater promotional dependence.
Households Use Several Methods to Protect Required Purchases
Shoppers are managing the pressure actively rather than cutting back across the board. Sixty-eight percent either track deals across retailers or look for deals while balancing convenience. Deal-seeking is therefore widespread, but it works alongside time, location and convenience. The lowest sticker price is only one part of what it costs a household to complete the list.
Seventy-one percent report at least one specific budgeting method. Twenty-nine percent make a list and try to follow it, 24% set aside money, 24% prioritize required items, 23% track spending while shopping and 21% spread purchases across pay periods. Because responses overlap, these work more like a toolkit than a set of competing shopper types: a household may use several at once on the same trip.
The single main-strategy question shows a descriptive pattern by income. Value-seeking is selected by 38% of shoppers with household income under $25,000, 31% at $25,000–$74,999 and 27% at $75,000–$124,999. In the $125,000–$249,999 group, 26% describe themselves as head-start planners and 25% as list followers, while 18% select value-seeking. The mix varies across income groups, but without formal statistical tests, it should not be read as an income effect; the lowest-income group is also small.
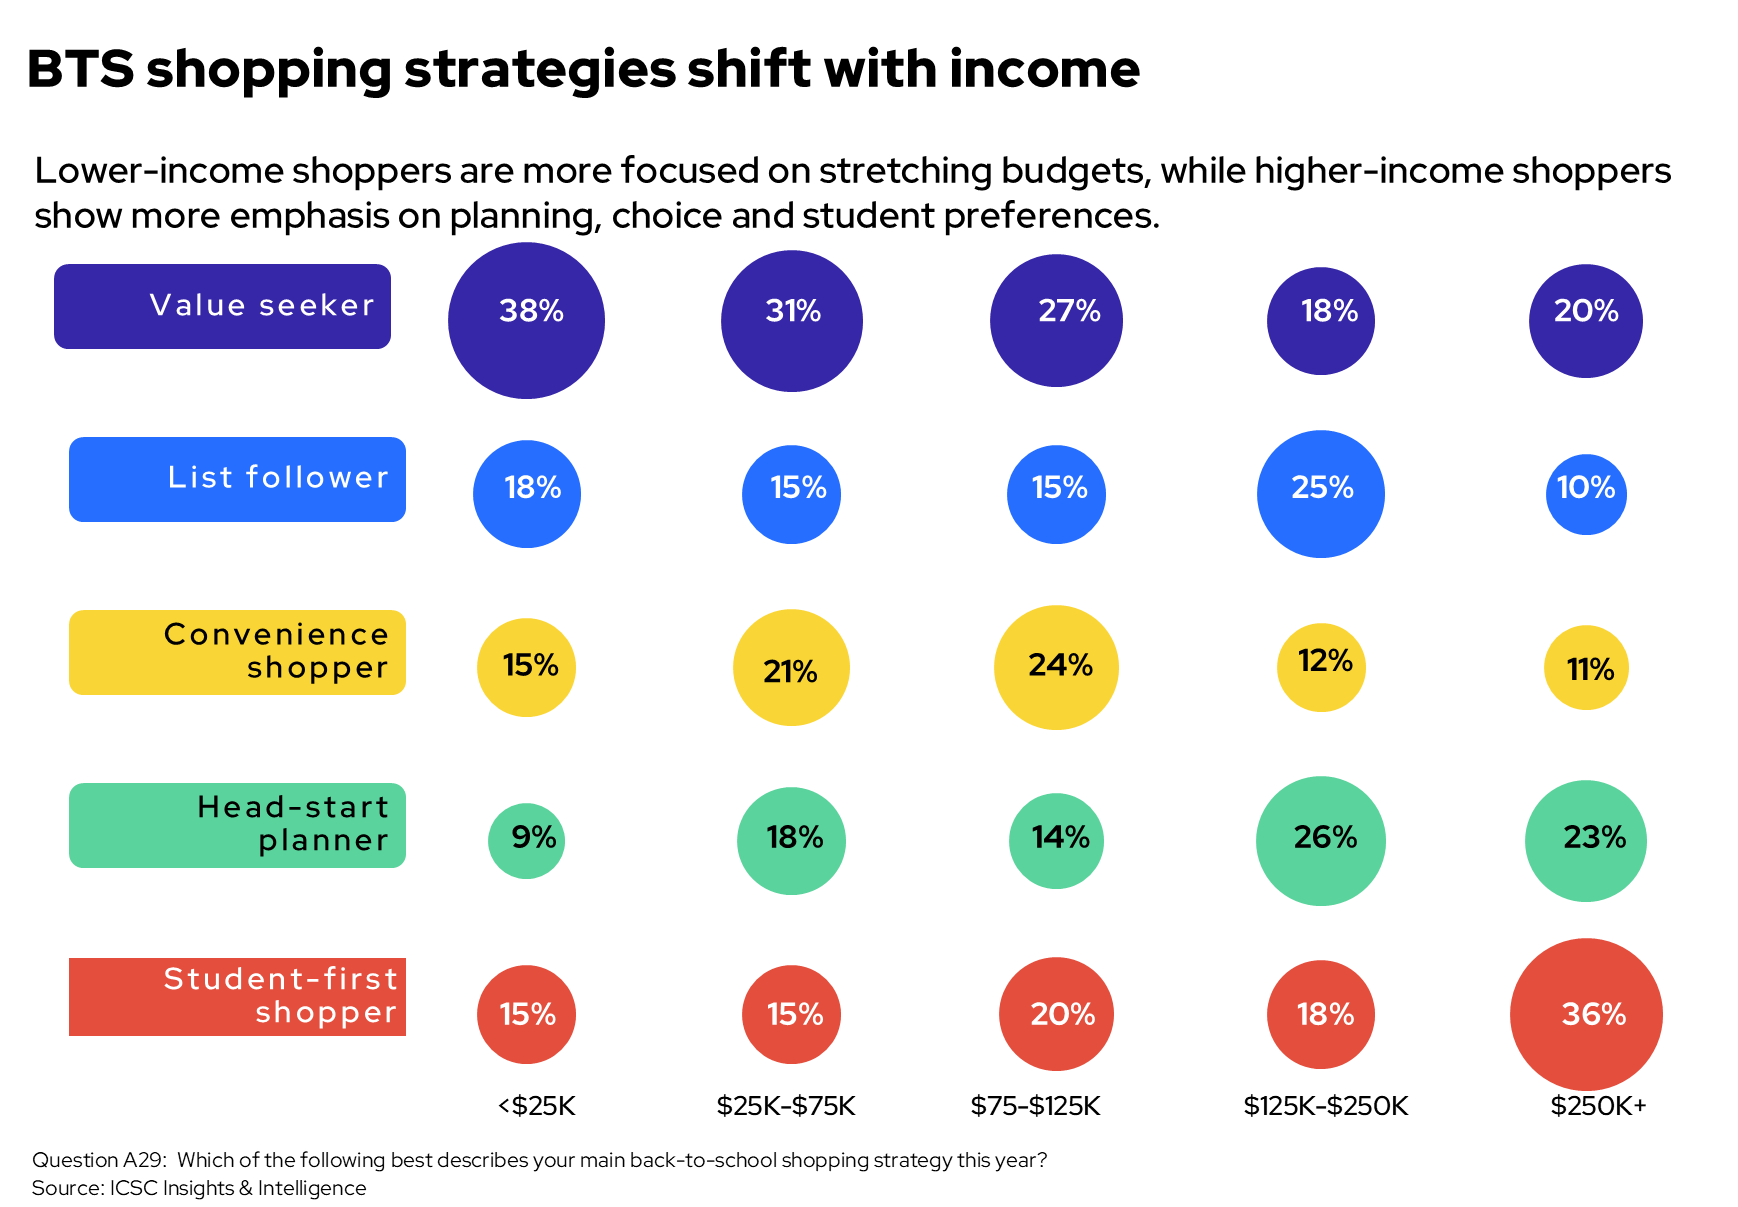
Figure 3: Main reported back-to-school shopping strategy by household income.
One takeaway is that value should be easy to see, without assuming every shopper defines it or perceives it the same way. Clear unit prices, plain promotion terms, dependable availability and good-better-best choices can make comparison easier. Reliable pickup windows and stock information can also keep a low price from turning costly in time, travel or a failed order.
K–12 and College Purchases Are Distinct Missions
A single back-to-school label covers different tasks. K–12 households often work from externally supplied lists while coordinating fit, student preferences and school requirements. College shopping can combine supplies and apparel with technology and living-space needs. The groups overlap, so they are not independent, but their profiles help explain why a single one-size-fits-all approach may fall short.
These figures show how many shoppers bought in each category, not how much they spent; the groups overlap and the comparisons are descriptive. Sources of influence also differ. School lists or teacher requirements are cited by 47% of K–12 shoppers and 25% of college shoppers; child or student preferences by 45% and 21%. In-store browsing is cited by 30% and 41%, while online browsing is cited by 26% and 45%. The results show reported sources of information, not proven causes, and they point to different moments when a retailer can reduce uncertainty.
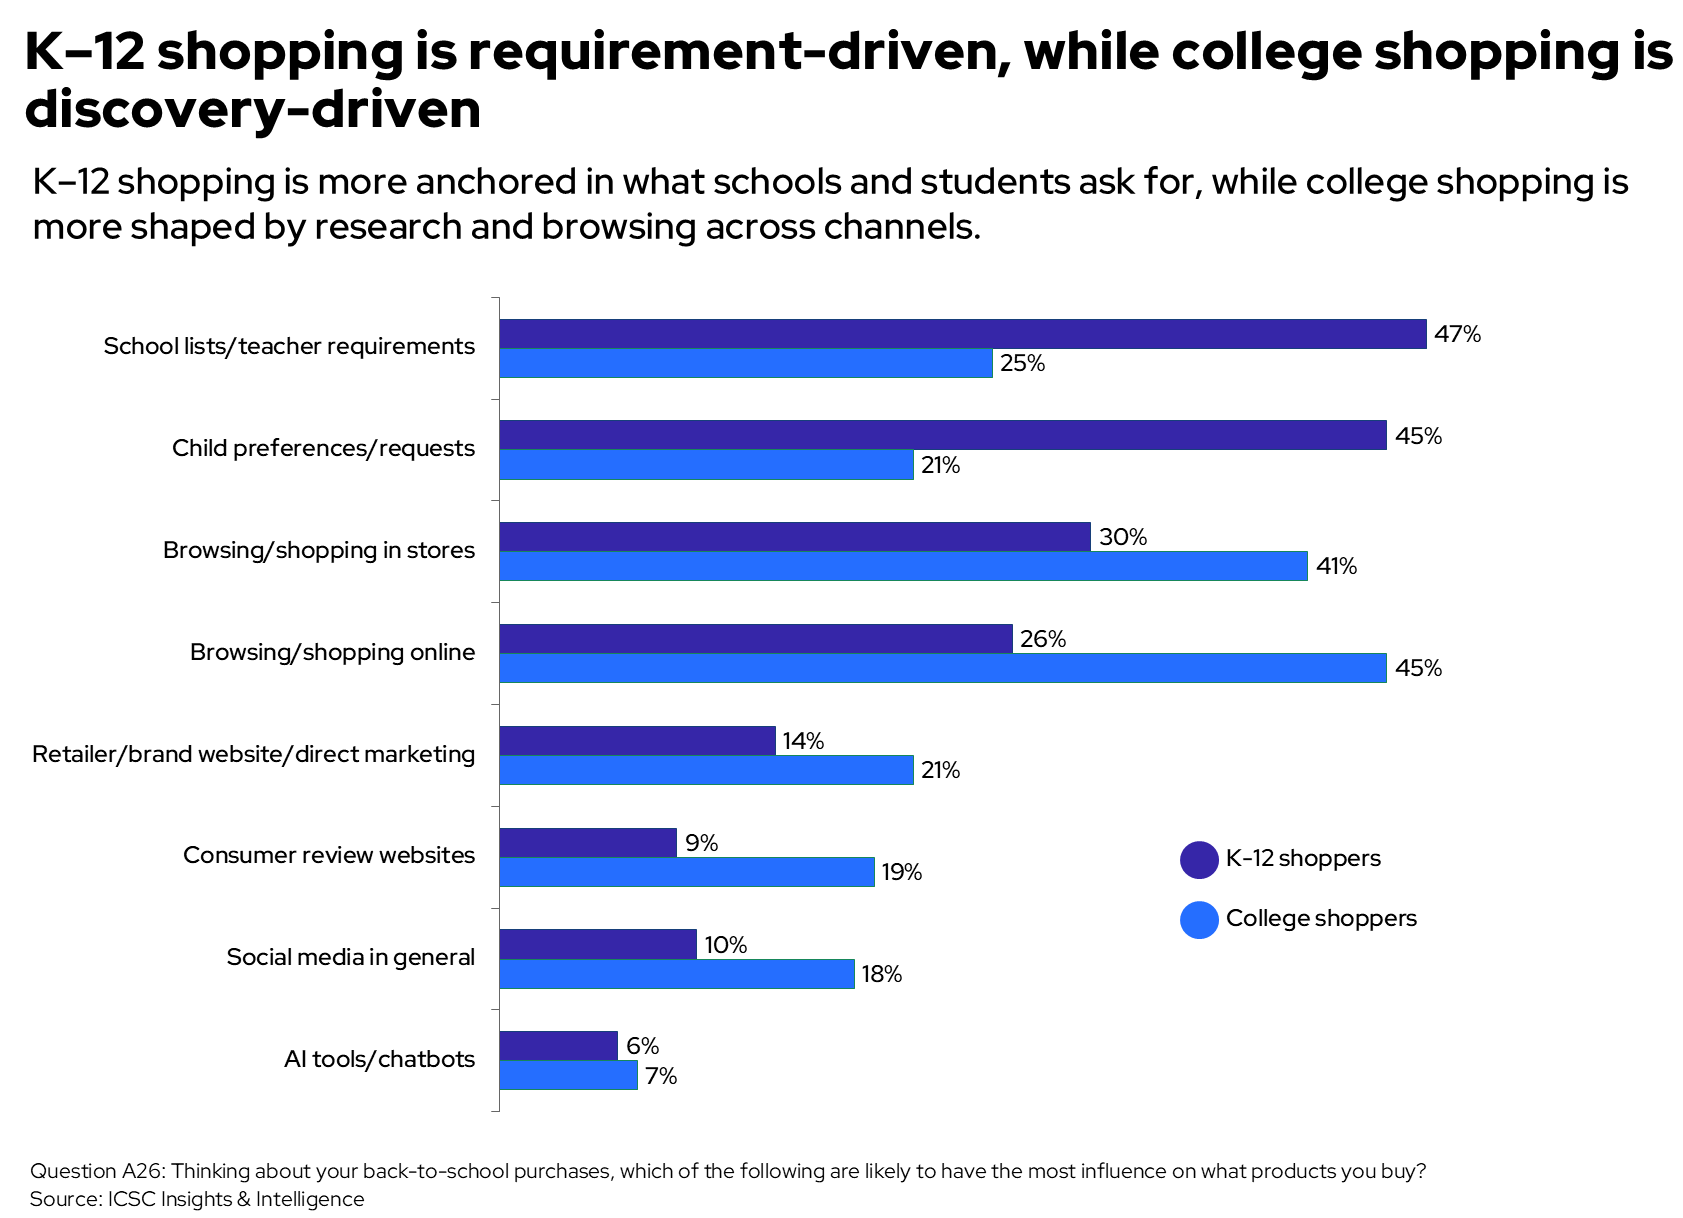
Figure 4: Reported purchase influences among K–12 and college shoppers.
Retailer choice is broad across the total shopper group. Sixty-three percent report discount stores, 57% Amazon, 34% apparel stores, 33% dollar stores and 26% off-price retailers, with additional formats also selected. The average respondent selects 3.8 listed retailer types. That average describes the range of formats used, not distinct brands, trips or transactions, and it confirms that households pull the season together across several types of stores.
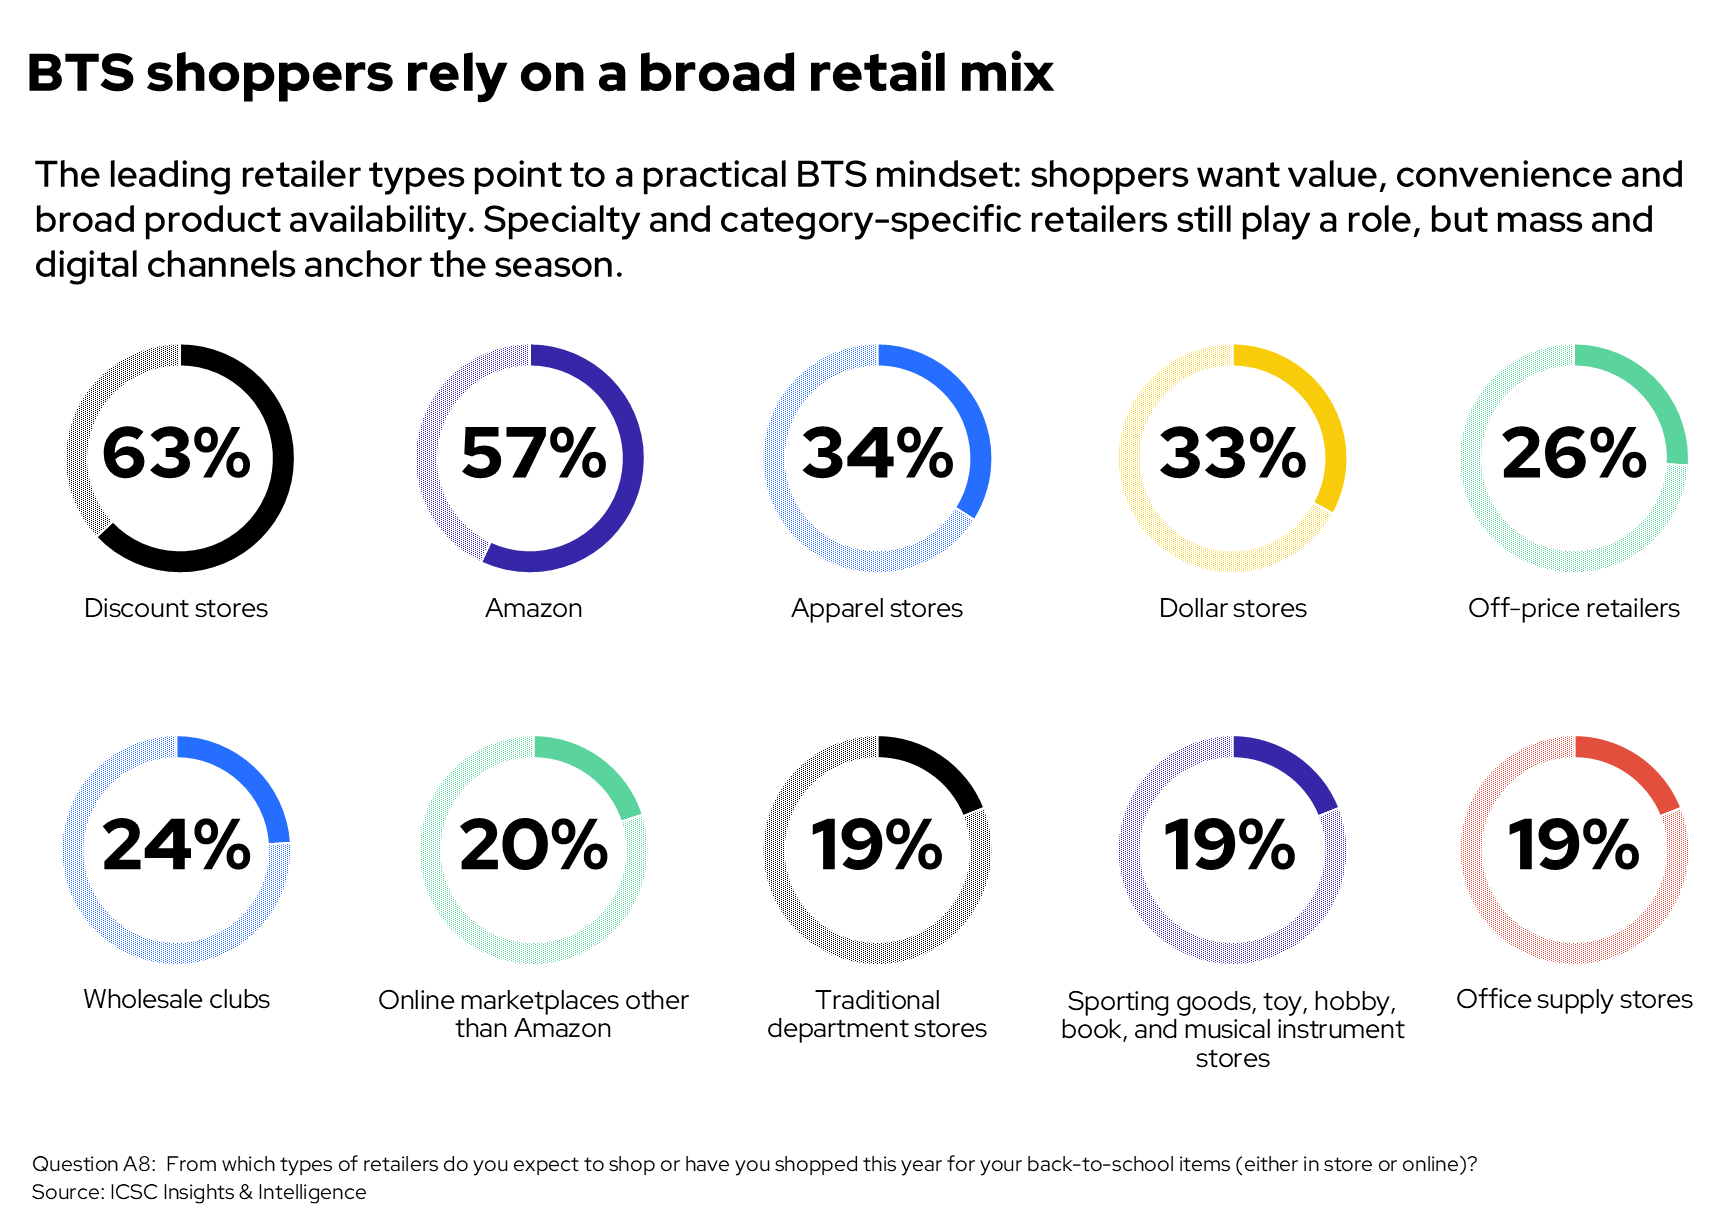
Figure 5: Retailer types used or expected to be used for back-to-school shopping.
Channel Use Is Broad; Allocation Still Matters
Back-to-school shopping is broadly omnichannel. Ninety-one percent report making or expecting to make at least some purchases in physical stores. Eighty-five percent report at least one online channel, including shipped orders or click-and-collect, and 76% report spending in store and online. These figures show reach: even a small purchase is enough to count a shopper as a user of that channel.
How spending is divided answers a different question. On average, respondents assign 49.5% of their reported spending to physical stores, 29.4% to shipped online orders, 16.3% to click-and-collect and 4.8% to other channels. The four means sum to 100% at the respondent level; they are not estimates of aggregate market sales. High online reach can go together with physical stores still taking the largest average share.
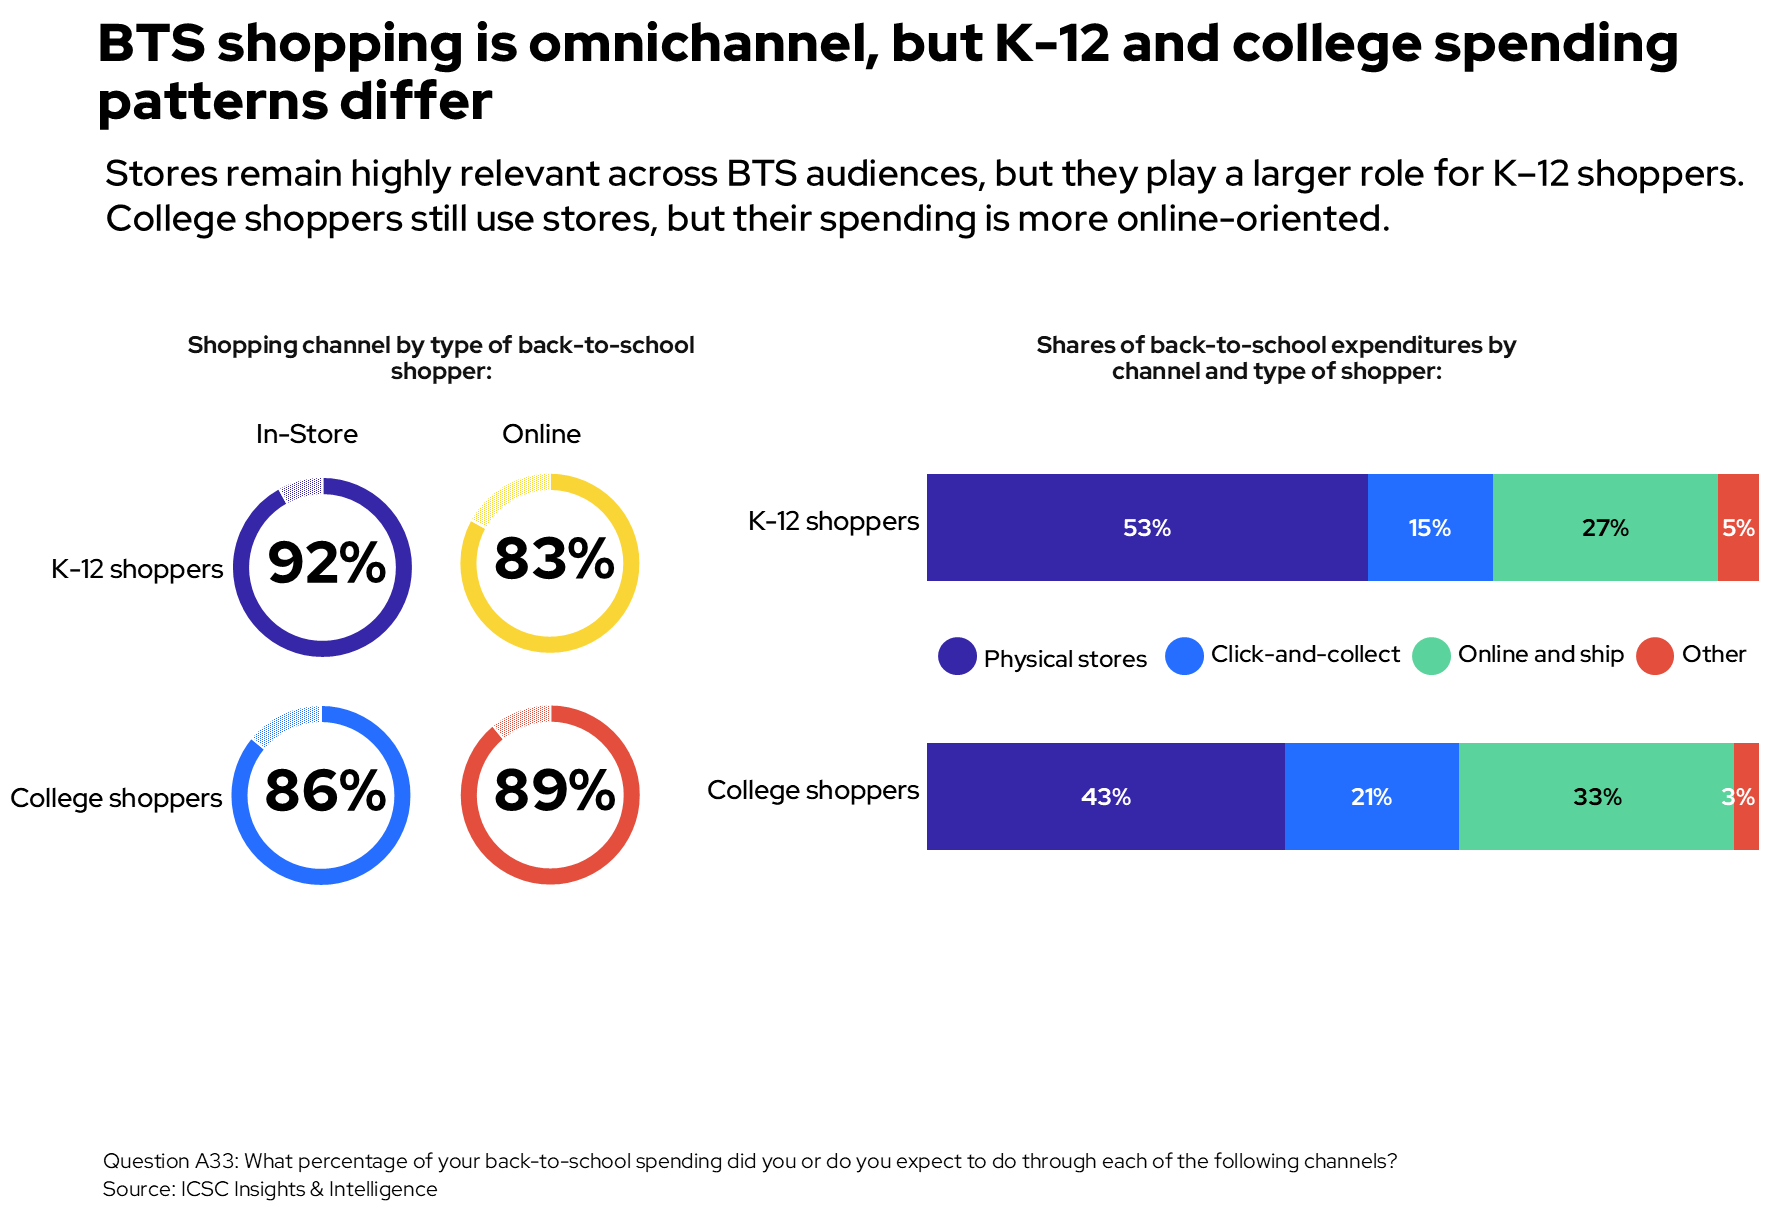
Figure 6: Shopping-channel use and mean reported spending allocation among K–12 and college shoppers.
Click-and-collect shows why a simple store-versus-online split is incomplete. The order begins digitally but depends on store inventory, pickup access and operating execution. Online search can precede a store visit, while in-store evaluation can lead to a later digital order. Each handoff either keeps transactions smooth or adds friction, so what matters is the whole journey rather than any single channel.
The reported reasons for buying in stores clarify the physical role. Among in-store shoppers, 53% cite checking quality, size, color or fit; 45% getting items immediately; 44% finding deals or clearance; and 42% letting the student see, try on or choose items. Stores offer confidence in the product, immediate possession and the chance for students to take part in the selection process.
Retailers can strengthen this by linking accurate inventory, online search, dependable pickup, simple returns and in-person help. The aim is not to push shoppers into one channel, but to keep the value created during browsing, comparison or purchase from being lost at the next step.
A Back-to-School Trip Often Covers Other Household Tasks
Among in-store shoppers, 93% expect to complete at least one other activity during the same trip. Fifty-five percent anticipate household-needs shopping, 47% dining and 44% non-school apparel shopping. Because the question permits multiple responses, these shares overlap. The result describes activities shoppers expect to combine, not extra revenue caused by the back-to-school trip.
The activity mix also differs descriptively by generation. Household-needs shopping is selected by 55% of Gen Z in-store shoppers, 57% of Millennials, 59% of Gen X and 35% of Baby Boomers; other errands are selected by 27%, 24%, 34% and 38%, respectively. The Gen Z group is small and no significance claims are made, but the table shows why the mix of useful activities may vary by local audience.
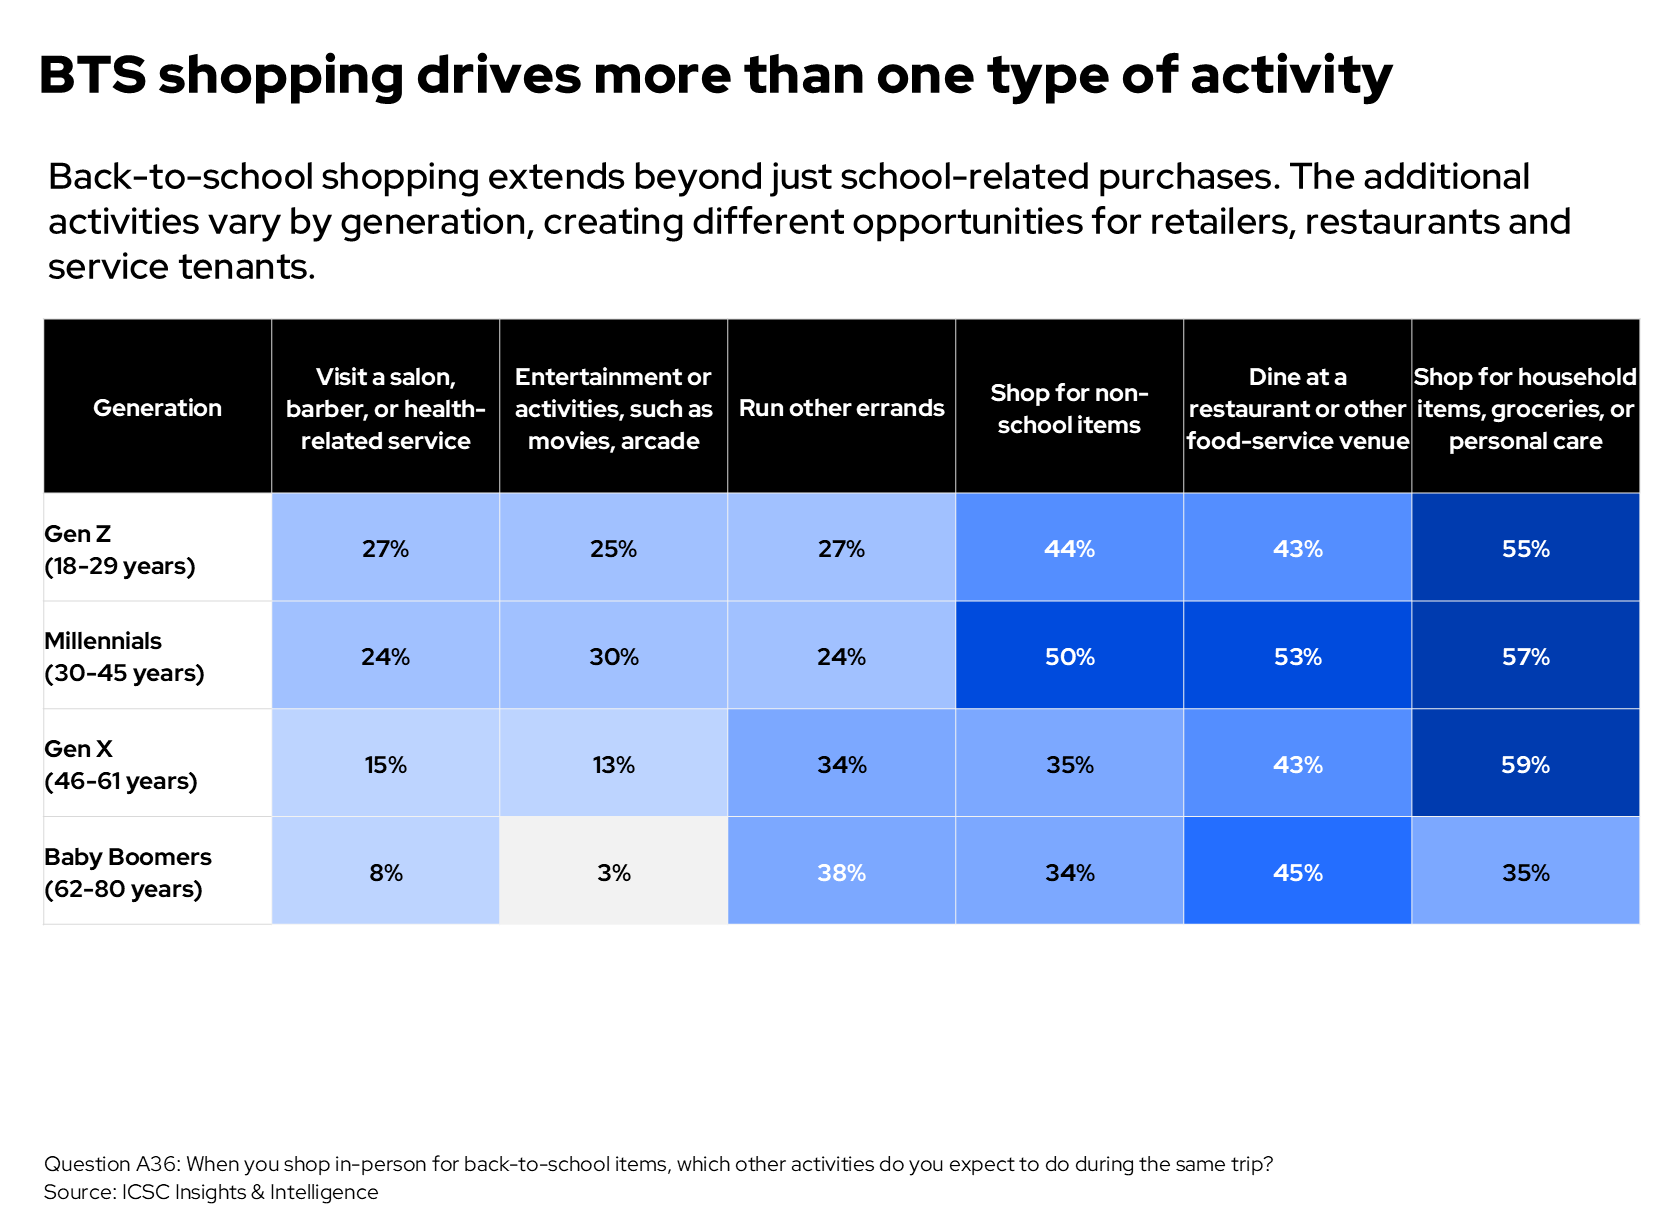
Figure 7: Expected activities during the same in-store back-to-school trip by generation.
Why This Matters
Required purchases create demand, but the commercial outcome depends on how well retailers and destinations help households manage price, uncertainty, timing and travel. The evidence points to a few practical priorities, best treated as ideas to test rather than proven steps.
Back-to-school is a season not a single shopping trip, so early weeks can support browsing and list-building while inventory, labor and fulfillment hold up for the August peak. Clear prices, dependable availability and good-better-best choices make value easy to compare, and tracking units, mix and margin alongside revenue helps separate price-driven growth from stronger demand. Online search, store inventory, pickup and returns work best as one system, in which a broken handoff can undo convenience created elsewhere. Coordinating access, hours and tenant offerings around a household's wider errands helps shoppers finish more in fewer trips, while the store itself stays a source of certainty—fit, inspection, immediate possession and student participation—supported by clear displays, knowledgeable help and easy returns. Because K–12, college and teacher needs differ, communication and navigation work best when organized around the task rather than a single path.
Methodology
The findings come from an online survey of 1,009 U.S. adults age 18 or older conducted July 6–8, 2026. The analysis is descriptive of surveyed respondents and should not be interpreted as a statistically representative estimate for all U.S. shoppers.
Percentages may not total 100 because of rounding, and multiple-response questions can exceed 100. Average spending allocations are means of respondent-reported percentages rather than shares of aggregate market expenditure. Subgroup comparisons are descriptive; the report makes no causal or statistical-significance claims.
Source: ICSC Back-to-School 2026 Survey